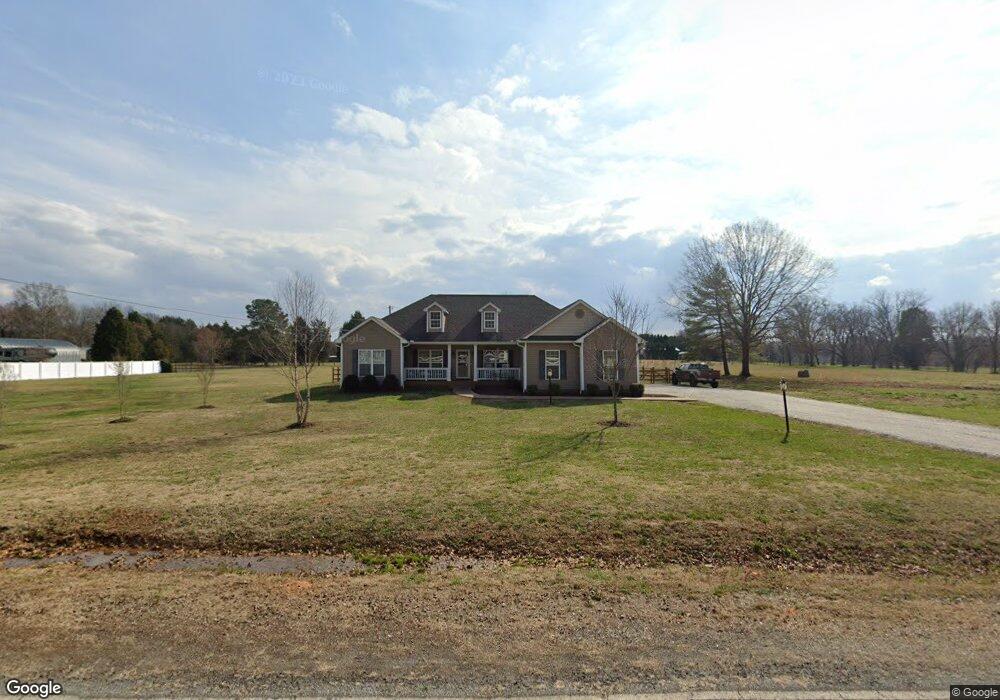
640 Trexler Loop Salisbury, NC 28144
Estimated Value: $342,000 - $374,089
Studio
--
Bath
1,782
Sq Ft
$200/Sq Ft
Est. Value
About This Home
This home is located at 640 Trexler Loop, Salisbury, NC 28144 and is currently estimated at $356,772, approximately $200 per square foot. 640 Trexler Loop is a home with nearby schools including North Rowan Elementary School, North Rowan Middle School, and North Rowan High School.
Ownership History
Date
Name
Owned For
Owner Type
Purchase Details
Closed on
Nov 21, 2022
Sold by
Hoben Kimberly M
Bought by
Mcnabb Steve Gordon and Mcnabb Cynthia B
Current Estimated Value
Home Financials for this Owner
Home Financials are based on the most recent Mortgage that was taken out on this home.
Original Mortgage
$340,000
Outstanding Balance
$325,489
Interest Rate
5.15%
Mortgage Type
New Conventional
Estimated Equity
$31,283
Purchase Details
Closed on
Dec 13, 2021
Sold by
Hoben Austin M
Bought by
Hoben Kimberly M
Purchase Details
Closed on
Mar 18, 2016
Sold by
Anderson Donald G and Anderson Nancy K
Bought by
Hoben Austin M and Monroe Kimberly M
Purchase Details
Closed on
Oct 2, 2012
Sold by
Cannon Larry P and Cannon Nora S
Bought by
Anderson Donald G and Anderson Nancy K
Create a Home Valuation Report for This Property
The Home Valuation Report is an in-depth analysis detailing your home's value as well as a comparison with similar homes in the area
Purchase History
| Date | Buyer | Sale Price | Title Company |
|---|---|---|---|
| Mcnabb Steve Gordon | $340,000 | -- | |
| Mcnabb Steve Gordon | $340,000 | None Listed On Document | |
| Hoben Kimberly M | -- | None Available | |
| Hoben Austin M | -- | None Available | |
| Anderson Donald G | $60,000 | None Available |
Source: Public Records
Mortgage History
| Date | Status | Borrower | Loan Amount |
|---|---|---|---|
| Open | Mcnabb Steve Gordon | $340,000 | |
| Closed | Mcnabb Steve Gordon | $340,000 |
Source: Public Records
Tax History
| Year | Tax Paid | Tax Assessment Tax Assessment Total Assessment is a certain percentage of the fair market value that is determined by local assessors to be the total taxable value of land and additions on the property. | Land | Improvement |
|---|---|---|---|---|
| 2025 | $2,137 | $321,397 | $49,641 | $271,756 |
| 2024 | $2,137 | $321,397 | $49,641 | $271,756 |
| 2023 | $2,137 | $321,397 | $49,641 | $271,756 |
| 2022 | $1,579 | $212,606 | $40,911 | $171,695 |
| 2021 | $1,579 | $212,606 | $40,911 | $171,695 |
| 2020 | $1,579 | $212,606 | $40,911 | $171,695 |
| 2019 | $1,579 | $212,606 | $40,911 | $171,695 |
| 2018 | $1,422 | $193,116 | $40,910 | $152,206 |
| 2017 | $1,422 | $193,116 | $40,910 | $152,206 |
| 2016 | $442 | $60,000 | $40,910 | $19,090 |
| 2015 | $449 | $60,000 | $40,910 | $19,090 |
| 2014 | $435 | $60,833 | $40,910 | $19,923 |
Source: Public Records
Map
Nearby Homes
- 110 Pantego Place
- 114 Pantego Place
- 115 Pantego Place
- 122 Pantego Place
- 123 Pantego Place
- 1490 Carthage Dr
- 115 Birkdale Dr
- 127 Pantego Place
- 111 Birkdale Dr
- 147 Aberdeen Dr
- 133 Pantego Place
- 102 Polo Dr
- 151 Birkdale Dr Unit 18
- 136 Pantego Place
- 201 Pantego Place
- 1480 Carthage Dr
- 1450 Carthage Dr
- 205 Pantego Place
- 1470 Carthage Dr
- 2484 Maxton Dr
- 720 Trexler Loop
- 580 Trexler Loop
- 725 Trexler Loop
- 615 Trexler Loop
- 185 Eagle Dr
- 550 Trexler Loop
- 2345 Old Mocksville Rd
- 2410 Old Mocksville Rd
- 480 Trexler Loop
- 180 Eagle Dr
- 1351 Morehead Dr
- 160 Eagle Dr
- 160 Eagle Dr
- 1277 Morehead Dr
- 1271 Morehead Dr
- 140 Eagle Dr
- 185 Trexler Loop
- 360 Trexler Loop
- 299 Trexler Loop
- 320 Oak Dr Unit 2
Your Personal Tour Guide
Ask me questions while you tour the home.