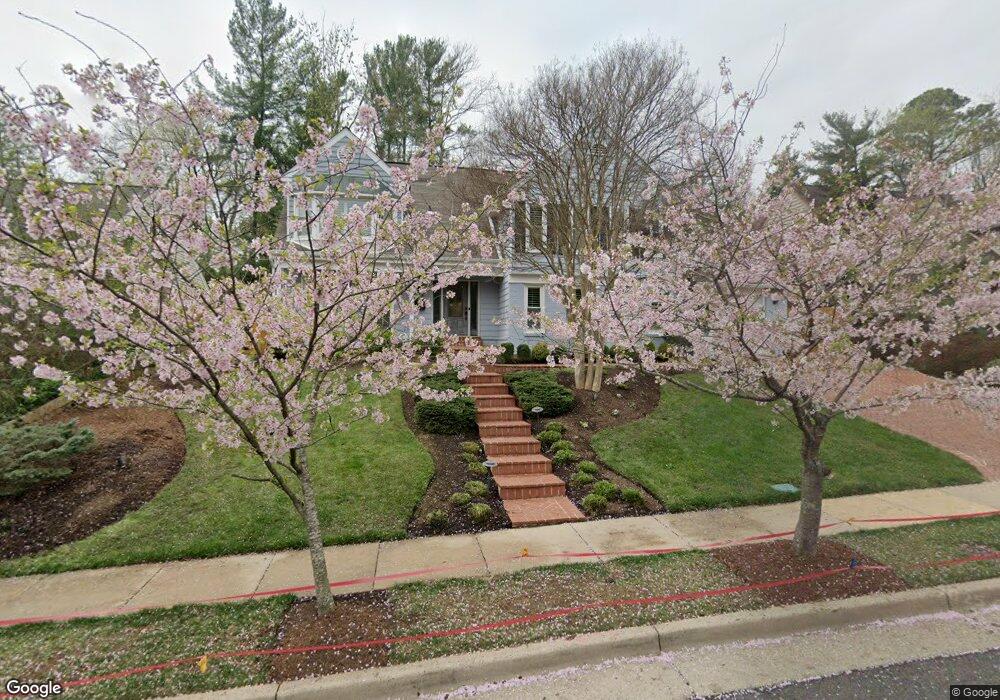
640 W Timber Branch Pkwy Alexandria, VA 22302
North Ridge NeighborhoodEstimated Value: $1,366,676 - $1,498,000
4
Beds
4
Baths
2,362
Sq Ft
$606/Sq Ft
Est. Value
About This Home
This home is located at 640 W Timber Branch Pkwy, Alexandria, VA 22302 and is currently estimated at $1,430,919, approximately $605 per square foot. 640 W Timber Branch Pkwy is a home located in Alexandria City with nearby schools including Douglas Macarthur Elementary School, George Washington Middle School, and Alexandria City High School.
Ownership History
Date
Name
Owned For
Owner Type
Purchase Details
Closed on
Jul 9, 2018
Sold by
Strauss Northern Jane
Bought by
Northern Jane Strauss and Revocable Trust Of Jane Straus
Current Estimated Value
Purchase Details
Closed on
Nov 7, 2011
Sold by
Mcgann Denise R
Bought by
Northern Jane S
Home Financials for this Owner
Home Financials are based on the most recent Mortgage that was taken out on this home.
Original Mortgage
$393,900
Outstanding Balance
$258,421
Interest Rate
3.25%
Mortgage Type
FHA
Estimated Equity
$1,172,498
Purchase Details
Closed on
Jul 18, 2006
Sold by
Looney Paul
Bought by
Mcgann Denise R
Home Financials for this Owner
Home Financials are based on the most recent Mortgage that was taken out on this home.
Original Mortgage
$223,600
Interest Rate
6.7%
Mortgage Type
Credit Line Revolving
Create a Home Valuation Report for This Property
The Home Valuation Report is an in-depth analysis detailing your home's value as well as a comparison with similar homes in the area
Home Values in the Area
Average Home Value in this Area
Purchase History
| Date | Buyer | Sale Price | Title Company |
|---|---|---|---|
| Northern Jane Strauss | -- | None Available | |
| Northern Jane S | $830,000 | -- | |
| Mcgann Denise R | $1,360,000 | -- |
Source: Public Records
Mortgage History
| Date | Status | Borrower | Loan Amount |
|---|---|---|---|
| Open | Northern Jane S | $393,900 | |
| Previous Owner | Mcgann Denise R | $223,600 | |
| Previous Owner | Mcgann Denise R | $1,000,000 |
Source: Public Records
Tax History Compared to Growth
Tax History
| Year | Tax Paid | Tax Assessment Tax Assessment Total Assessment is a certain percentage of the fair market value that is determined by local assessors to be the total taxable value of land and additions on the property. | Land | Improvement |
|---|---|---|---|---|
| 2025 | $15,027 | $1,276,800 | $562,020 | $714,780 |
| 2024 | $15,027 | $1,252,035 | $551,000 | $701,035 |
| 2023 | $13,898 | $1,252,035 | $551,000 | $701,035 |
| 2022 | $13,269 | $1,195,441 | $530,145 | $665,296 |
| 2021 | $12,623 | $1,137,206 | $504,900 | $632,306 |
| 2020 | $13,107 | $1,124,903 | $504,900 | $620,003 |
| 2019 | $12,400 | $1,097,315 | $504,900 | $592,415 |
| 2018 | $11,881 | $1,051,415 | $459,000 | $592,415 |
| 2017 | $11,487 | $1,016,508 | $450,000 | $566,508 |
| 2016 | $10,907 | $1,016,508 | $450,000 | $566,508 |
| 2015 | $10,219 | $979,758 | $413,250 | $566,508 |
| 2014 | $11,459 | $1,098,633 | $350,322 | $748,311 |
Source: Public Records
Map
Nearby Homes
- 1104 Tuckahoe Ln
- 723 Timber Branch Dr
- 620 Melrose St
- 2700 Bryan Place
- 2401 Ridge Road Dr
- 2025 Scroggins Rd
- 1306 Bishop Ln
- 15 W Spring St
- 133 E Taylor Run Pkwy
- 320 -1/2 Mansion Dr
- 122 Roberts Ln Unit 400
- 53 Skyhill Rd Unit 204
- 53 Skyhill Rd Unit 301
- 51 Skyhill Rd Unit 202
- 49 Skyhill Rd Unit 201
- 1 E Custis Ave
- 110 Roberts Ln Unit 301
- 5A E Custis Ave
- 206 N View Terrace
- 100 Roberts Ln Unit 300
- 636 W Timber Branch Pkwy
- 644 W Timber Branch Pkwy
- 634 W Timber Branch Pkwy
- 1105 Bayliss Dr
- 1107 Bayliss Dr
- 648 W Timber Branch Pkwy
- 1101 Bayliss Dr
- 656 W Timber Branch Pkwy
- 1111 Bayliss Dr
- 1100 Bayliss Dr
- 662 W Timber Branch Pkwy
- 1115 Bayliss Dr
- 605 E Timber Branch Pkwy
- 649 Oakland Terrace
- 647 Oakland Terrace
- 1102 Bayliss Dr
- 646 Oakland Terrace
- 670 W Timber Branch Pkwy
- 1119 Bayliss Dr
- 630 Oakley Place