Estimated Value: $298,932 - $353,000
3
Beds
2
Baths
1,715
Sq Ft
$185/Sq Ft
Est. Value
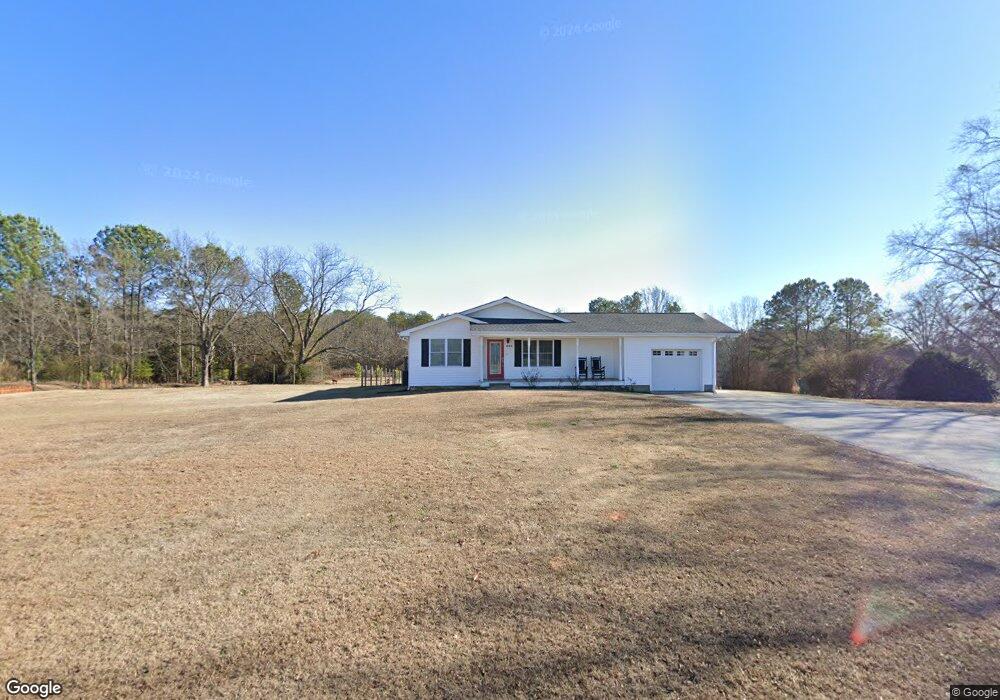
About This Home
This home is located at 640 Windmill Hill Rd, Inman, SC 29349 and is currently estimated at $316,733, approximately $184 per square foot. 640 Windmill Hill Rd is a home located in Spartanburg County with nearby schools including Inman Elementary School, T.E. Mabry Middle School, and Chapman High School.
Ownership History
Date
Name
Owned For
Owner Type
Purchase Details
Closed on
Aug 17, 2022
Sold by
Hutcherson Bobby G
Bought by
Mullins Denver
Current Estimated Value
Purchase Details
Closed on
Nov 29, 2012
Sold by
Daugherty Tonya L
Bought by
Daugherty Jerry W
Purchase Details
Closed on
Nov 25, 2012
Sold by
Daugherty Jerry W
Bought by
Daugherty Jerrry Shayne and Daugherty Shannon Lance
Purchase Details
Closed on
Feb 1, 2011
Sold by
Daugherty Jerry W
Bought by
Hutcherson Bobby G and Hutcherson Monica D
Purchase Details
Closed on
May 19, 2010
Sold by
Daugherty Jerry W
Bought by
Hutcherson Bobby G and Hutcherson Monica D
Purchase Details
Closed on
Sep 29, 2009
Sold by
Daugherty Jerry W and Daugherty Tonya L
Bought by
Hutcherson Bobby G and Hutcherson Monica D
Create a Home Valuation Report for This Property
The Home Valuation Report is an in-depth analysis detailing your home's value as well as a comparison with similar homes in the area
Home Values in the Area
Average Home Value in this Area
Purchase History
| Date | Buyer | Sale Price | Title Company |
|---|---|---|---|
| Mullins Denver | -- | -- | |
| Mullins Denver | -- | -- | |
| Daugherty Jerry W | -- | -- | |
| Daugherty Jerrry Shayne | -- | -- | |
| Hutcherson Bobby G | -- | -- | |
| Hutcherson Bobby G | -- | -- | |
| Hutcherson Bobby G | -- | -- |
Source: Public Records
Tax History Compared to Growth
Tax History
| Year | Tax Paid | Tax Assessment Tax Assessment Total Assessment is a certain percentage of the fair market value that is determined by local assessors to be the total taxable value of land and additions on the property. | Land | Improvement |
|---|---|---|---|---|
| 2025 | $2,635 | $9,542 | $2,496 | $7,046 |
| 2024 | $2,635 | $9,542 | $2,496 | $7,046 |
| 2023 | $2,635 | $9,542 | $2,496 | $7,046 |
| 2022 | $2,437 | $8,418 | $2,062 | $6,356 |
| 2021 | $2,506 | $8,418 | $2,062 | $6,356 |
| 2020 | $976 | $5,184 | $1,828 | $3,356 |
| 2019 | $976 | $5,184 | $1,828 | $3,356 |
| 2018 | $976 | $5,184 | $1,828 | $3,356 |
| 2017 | $886 | $4,612 | $1,760 | $2,852 |
| 2016 | $886 | $4,612 | $1,760 | $2,852 |
| 2015 | $866 | $4,612 | $1,760 | $2,852 |
| 2014 | $860 | $4,612 | $1,760 | $2,852 |
Source: Public Records
Map
Nearby Homes
- 155 Cothran Rd
- 128 Cothran Rd
- 415 Grady Dr
- 107 Denali St
- 119 Beechwood Dr
- 0 Johnson Ave
- 704 Adaline Dr
- 00 State Road S-42-371
- 140 Golightly St
- 9041 Asheville Hwy
- 340 State Road S-42-779
- 135 Glendarosa Dr
- Heatherwood Plan at Stones Throw
- Inman Plan at Stones Throw
- Reynolds Plan at Stones Throw
- Quincy Plan at Stones Throw
- Ellison Plan at Stones Throw
- Clifton Plan at Stones Throw
- Wellford Plan at Stones Throw
- Pacific Plan at Stones Throw
- 641 Windmill Hill Rd
- 616 Windmill Hill Rd
- 651 Windmill Hill Rd
- 660 Windmill Hill Rd
- 629 Windmill Hill Rd
- 601 Windmill Hill Rd
- 680 Windmill Hill Rd
- 560 Windmill Hill Rd
- 131 Cothran Rd
- 461 Cardinal St
- 561 Windmill Hill Rd
- 137 Cothran Rd
- 695 Windmill Hill Rd
- 400 Cardinal St
- 143 Cothran Rd
- 451 Cardinal St Unit 461
- 551 Windmill Hill Rd
- 536 Windmill Hill Rd
- 571 Windmill Hill Rd
- 391 Cardinal St