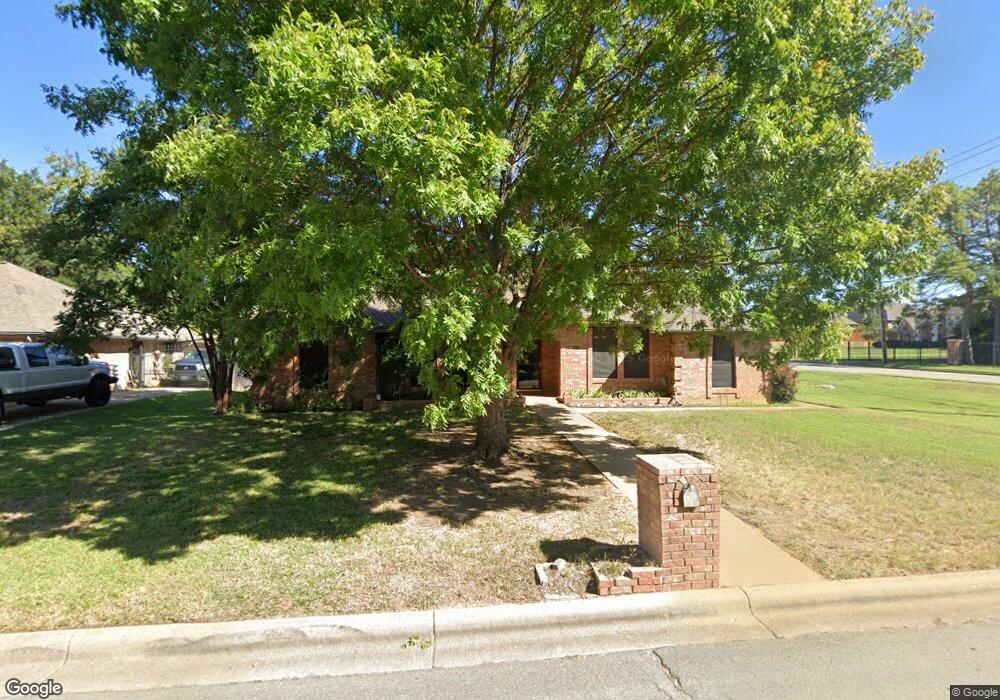
6400 Chilton Dr North Richland Hills, TX 76182
Estimated Value: $403,000 - $445,000
3
Beds
2
Baths
2,149
Sq Ft
$199/Sq Ft
Est. Value
About This Home
This home is located at 6400 Chilton Dr, North Richland Hills, TX 76182 and is currently estimated at $427,052, approximately $198 per square foot. 6400 Chilton Dr is a home located in Tarrant County with nearby schools including Walker Creek Elementary School, Smithfield Middle School, and Birdville High School.
Ownership History
Date
Name
Owned For
Owner Type
Purchase Details
Closed on
Feb 3, 2014
Sold by
Fenner Roberta Butts
Bought by
Fenner Roberta Butts
Current Estimated Value
Purchase Details
Closed on
Sep 28, 2011
Sold by
Scribner Buddy L and Schribner Marilyn
Bought by
Fenner James and Fenner Roberta
Purchase Details
Closed on
Oct 28, 1996
Sold by
Hawkins Michael J and Hawkins Leslie W
Bought by
Scribner Buddy L and Scribner Marilynn
Home Financials for this Owner
Home Financials are based on the most recent Mortgage that was taken out on this home.
Original Mortgage
$90,000
Interest Rate
6.87%
Purchase Details
Closed on
Dec 21, 1994
Sold by
Scott Norman Larry and Scott Geraldine Phillips
Bought by
Hawkins Michael J and Hawkins Leslie W
Home Financials for this Owner
Home Financials are based on the most recent Mortgage that was taken out on this home.
Original Mortgage
$105,250
Interest Rate
9.07%
Create a Home Valuation Report for This Property
The Home Valuation Report is an in-depth analysis detailing your home's value as well as a comparison with similar homes in the area
Home Values in the Area
Average Home Value in this Area
Purchase History
| Date | Buyer | Sale Price | Title Company |
|---|---|---|---|
| Fenner Roberta Butts | -- | None Available | |
| Fenner James | -- | Hftc | |
| Scribner Buddy L | -- | Trinity Western Title Co | |
| Hawkins Michael J | -- | Trinity Western Title Co |
Source: Public Records
Mortgage History
| Date | Status | Borrower | Loan Amount |
|---|---|---|---|
| Previous Owner | Scribner Buddy L | $90,000 | |
| Previous Owner | Hawkins Michael J | $105,250 |
Source: Public Records
Tax History Compared to Growth
Tax History
| Year | Tax Paid | Tax Assessment Tax Assessment Total Assessment is a certain percentage of the fair market value that is determined by local assessors to be the total taxable value of land and additions on the property. | Land | Improvement |
|---|---|---|---|---|
| 2025 | $1,459 | $412,719 | $112,752 | $299,967 |
| 2024 | $1,459 | $412,719 | $112,752 | $299,967 |
| 2023 | $7,218 | $409,632 | $112,752 | $296,880 |
| 2022 | $7,198 | $314,906 | $40,000 | $274,906 |
| 2021 | $6,920 | $313,594 | $40,000 | $273,594 |
| 2020 | $6,290 | $266,716 | $40,000 | $226,716 |
| 2019 | $5,918 | $268,501 | $40,000 | $228,501 |
| 2018 | $2,463 | $204,309 | $40,000 | $164,309 |
| 2017 | $4,997 | $213,314 | $35,000 | $178,314 |
| 2016 | $4,543 | $196,319 | $17,000 | $179,319 |
| 2015 | $2,498 | $153,500 | $17,000 | $136,500 |
| 2014 | $2,498 | $153,500 | $17,000 | $136,500 |
Source: Public Records
Map
Nearby Homes
- 6432 Brynwyck Ln
- 8920 Martin Dr
- 6505 Parkway Ave
- 6509 Paula Ct
- 8886 Ice House Dr
- 6625 Crane Rd
- 8740 Ice House Dr
- 6521 Rock Springs Dr
- 8858 Mandalay St
- 8748 Morris Mews
- 6137 Marquita Mews
- 6116 Morningside Dr
- 8412 Glenann Dr
- 8409 Main St
- 8436 Town Walk Dr
- 8421 Randy Dr
- 8765 Bridge St
- 8409 Glenann Dr
- 8420 Town Walk Dr
- 6008 Monterey Mews
- 6404 Chilton Dr
- 6408 Chilton Dr
- 6401 Chilton Dr
- 6405 Chilton Dr
- 8801 Martin Dr
- 8800 Martin Dr
- 6452 Brynwyck Ln
- 6409 Chilton Dr
- 6412 Chilton Dr
- 6448 Brynwyck Ln
- 6404 Blake Ct
- 6413 Chilton Dr
- 6444 Brynwyck Ln
- 6416 Chilton Dr
- 6451 Hawks Ridge Dr
- 8820 Martin Dr
- 6400 Blake Ct
- 6408 Blake Ct
- 6440 Brynwyck Ln
- 6417 Chilton Dr