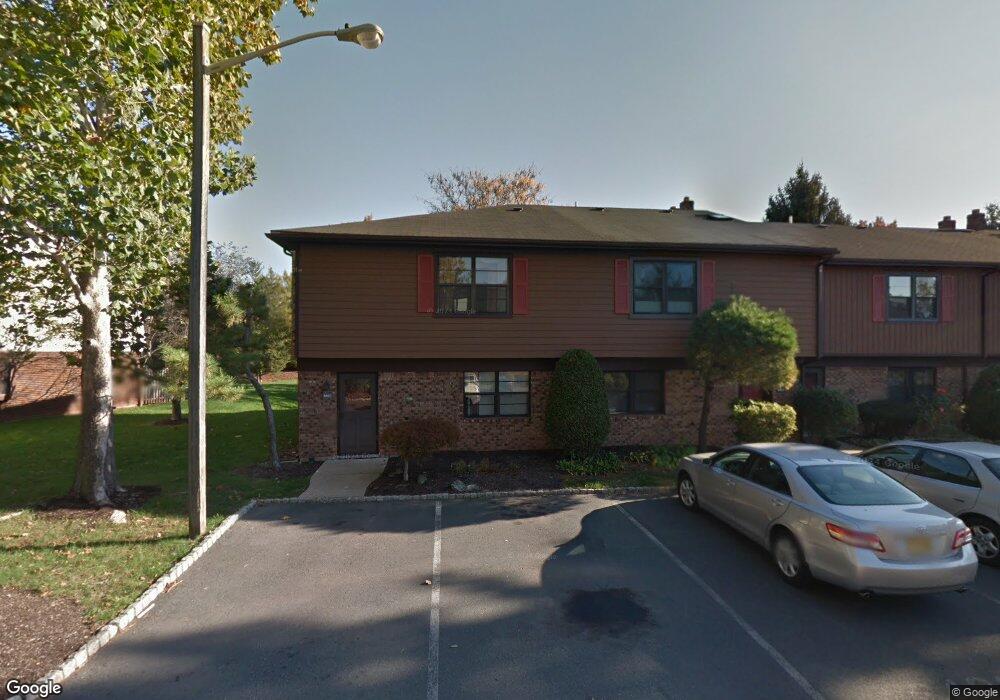
6401 Hana Rd Edison, NJ 08817
Estimated Value: $518,000 - $578,000
3
Beds
3
Baths
1,672
Sq Ft
$321/Sq Ft
Est. Value
About This Home
This home is located at 6401 Hana Rd, Edison, NJ 08817 and is currently estimated at $536,663, approximately $320 per square foot. 6401 Hana Rd is a home located in Middlesex County with nearby schools including John Marshall Elementary School, Thomas Jefferson Middle School, and Edison High School.
Ownership History
Date
Name
Owned For
Owner Type
Purchase Details
Closed on
Jan 31, 2008
Sold by
Ramasamy Ramu and Dhinakaran Alamelu
Bought by
Rahman Ahmad A
Current Estimated Value
Home Financials for this Owner
Home Financials are based on the most recent Mortgage that was taken out on this home.
Original Mortgage
$306,375
Outstanding Balance
$194,060
Interest Rate
6.14%
Mortgage Type
New Conventional
Estimated Equity
$342,603
Purchase Details
Closed on
Sep 30, 2004
Sold by
Im Il
Bought by
Ramasamy Ramu and Dhinakaran Alamelu
Home Financials for this Owner
Home Financials are based on the most recent Mortgage that was taken out on this home.
Original Mortgage
$233,600
Interest Rate
5.63%
Purchase Details
Closed on
Oct 5, 2001
Sold by
Sumal Parimindre
Bought by
Im Il
Home Financials for this Owner
Home Financials are based on the most recent Mortgage that was taken out on this home.
Original Mortgage
$182,100
Interest Rate
6.86%
Mortgage Type
FHA
Create a Home Valuation Report for This Property
The Home Valuation Report is an in-depth analysis detailing your home's value as well as a comparison with similar homes in the area
Home Values in the Area
Average Home Value in this Area
Purchase History
| Date | Buyer | Sale Price | Title Company |
|---|---|---|---|
| Rahman Ahmad A | $322,500 | -- | |
| Ramasamy Ramu | $292,000 | -- | |
| Im Il | $185,000 | -- |
Source: Public Records
Mortgage History
| Date | Status | Borrower | Loan Amount |
|---|---|---|---|
| Open | Rahman Ahmad A | $306,375 | |
| Previous Owner | Ramasamy Ramu | $233,600 | |
| Previous Owner | Im Il | $182,100 |
Source: Public Records
Tax History
| Year | Tax Paid | Tax Assessment Tax Assessment Total Assessment is a certain percentage of the fair market value that is determined by local assessors to be the total taxable value of land and additions on the property. | Land | Improvement |
|---|---|---|---|---|
| 2025 | $6,792 | $114,100 | $31,600 | $82,500 |
| 2024 | $6,756 | $114,100 | $31,600 | $82,500 |
Source: Public Records
Map
Nearby Homes
- 7107 Hana Rd
- 4805 Hana Rd
- 0-142&134 Ethel Rd
- 806 Jesse Way Unit 806
- 501 Jesse Way
- 1506 Jesse Way
- 2704 Jesse Way
- 1702 Amanda Ct
- 253 Nebula Rd
- 2 Lioni Ct
- 30 Rachel Terrace
- 1518 Raspberry Ct
- 1947 Raspberry Ct
- 4 Rachel Terrace
- 9 Water St
- 449 Plainfield Ave
- 1233 Waterford Dr
- 1532 Waterford Dr
- 1218 Waterford Dr
- 1227 Waterford Dr
Your Personal Tour Guide
Ask me questions while you tour the home.