Estimated Value: $474,000 - $534,000
4
Beds
3
Baths
3,510
Sq Ft
$145/Sq Ft
Est. Value
About This Home
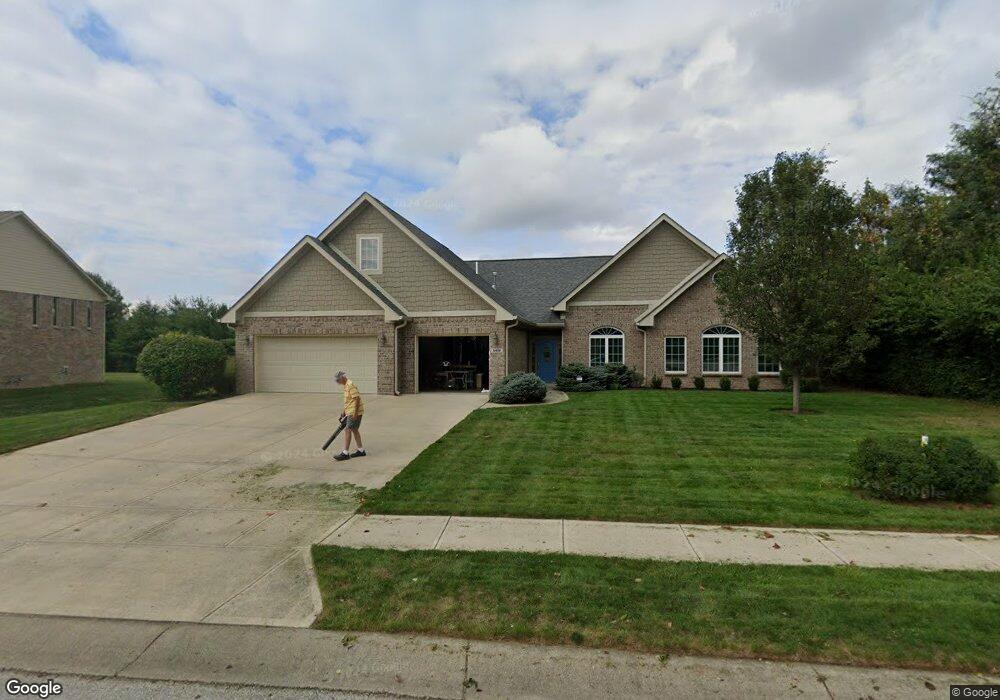
This home is located at 6402 Canak Dr, Avon, IN 46123 and is currently estimated at $509,640, approximately $145 per square foot. 6402 Canak Dr is a home located in Hendricks County with nearby schools including White Oak Elementary School, Cedar Elementary School, and Avon Intermediate School West.
Ownership History
Date
Name
Owned For
Owner Type
Purchase Details
Closed on
May 30, 2023
Sold by
Thistle Paul A and Thistle Deborah G
Bought by
Thistle Family Trust
Current Estimated Value
Purchase Details
Closed on
Jan 31, 2014
Sold by
Two West Llc
Bought by
Thistle Paul A and Thistle Deborah G
Purchase Details
Closed on
Jul 12, 2012
Sold by
Johnson Curt A and Johnson Tara L
Bought by
Two West Llc
Purchase Details
Closed on
Apr 6, 2009
Sold by
Legacy Property Management Llp
Bought by
Johnson Curt A and Johnson Tara L
Create a Home Valuation Report for This Property
The Home Valuation Report is an in-depth analysis detailing your home's value as well as a comparison with similar homes in the area
Home Values in the Area
Average Home Value in this Area
Purchase History
| Date | Buyer | Sale Price | Title Company |
|---|---|---|---|
| Thistle Family Trust | -- | None Listed On Document | |
| Thistle Paul A | -- | -- | |
| Two West Llc | -- | None Available | |
| Johnson Curt A | -- | None Available |
Source: Public Records
Tax History Compared to Growth
Tax History
| Year | Tax Paid | Tax Assessment Tax Assessment Total Assessment is a certain percentage of the fair market value that is determined by local assessors to be the total taxable value of land and additions on the property. | Land | Improvement |
|---|---|---|---|---|
| 2024 | $5,660 | $489,700 | $43,600 | $446,100 |
| 2023 | $5,173 | $449,500 | $39,600 | $409,900 |
| 2022 | $5,010 | $430,800 | $37,500 | $393,300 |
| 2021 | $4,277 | $365,600 | $37,500 | $328,100 |
| 2020 | $4,131 | $350,300 | $37,500 | $312,800 |
| 2019 | $3,992 | $333,800 | $35,600 | $298,200 |
| 2018 | $3,997 | $327,900 | $35,600 | $292,300 |
| 2017 | $3,238 | $313,800 | $35,600 | $278,200 |
| 2016 | $3,131 | $303,100 | $35,600 | $267,500 |
| 2014 | $559 | $23,500 | $23,500 | $0 |
Source: Public Records
Map
Nearby Homes
- 6589 Avalon Blvd
- 2434 Burgundy Way
- 1914 Delp Ct
- 6862 Trailside Dr
- 6374 Timberbluff Cir
- 0 S Avon Ave Unit MBR22032323
- 6229 Catalpa Dr
- 1914 S State Rd
- 1829 Bentbrook Dr
- 6012 Yellow Birch Ct
- 6013 Yellow Birch Ct
- 7128 Verwood Ct
- 7315 Hidden Valley Dr
- 1893 Water Oak Way
- 7370 Hidden Valley Dr
- 7356 Oakview Dr
- 7440 Oakview Dr
- 1478 S Avon Ave
- 7155 E County Road 150 S
- 7686 Rolling Green Dr
- 6392 Canak Dr
- 2257 Michelle Dr
- 2253 Michelle Dr
- 2248 Michelle Dr
- 6403 Canak Dr
- 6428 Canak Dr
- 6609 Avalon Blvd
- 6386 Canak Dr
- 6417 Canak Dr
- 6649 Avalon Blvd
- 6629 Avalon Blvd
- 6442 Canak Dr
- 6389 Canak Dr
- 6565 Avalon Blvd
- 6671 Avalon Blvd
- 6372 Canak Dr
- 2254 Michelle Dr
- 2288 Michelle Dr
- 2287 Michelle Dr
- 6375 Canak Dr