Estimated Value: $274,626 - $346,000
3
Beds
3
Baths
1,265
Sq Ft
$236/Sq Ft
Est. Value
About This Home
This home is located at 6405 S Pipe Creek Mill Rd, Peru, IN 46970 and is currently estimated at $298,542, approximately $236 per square foot. 6405 S Pipe Creek Mill Rd is a home located in Miami County with nearby schools including Pipe Creek Elementary School, Maconaquah Elementary School, and Maconaquah Middle School.
Ownership History
Date
Name
Owned For
Owner Type
Purchase Details
Closed on
Mar 19, 2024
Sold by
John And Janet Riggle Revocable Living T and Riggle Janet Marie
Bought by
Cotten Teresa Marie
Current Estimated Value
Purchase Details
Closed on
Sep 27, 2021
Sold by
Riggle Janet Marie
Bought by
John And Janet Riggle Revocable Living Trust and Riggle
Home Financials for this Owner
Home Financials are based on the most recent Mortgage that was taken out on this home.
Original Mortgage
$162,258
Interest Rate
2.99%
Mortgage Type
New Conventional
Purchase Details
Closed on
Nov 27, 2018
Sold by
Riggle Janet Marie and Riggle John William
Bought by
Riggle Janet Marie and Riggle John
Purchase Details
Closed on
Nov 9, 2005
Sold by
Riggle John William and Riggle Janet Marie
Bought by
Riggle John William and Riggle Janet Marie
Create a Home Valuation Report for This Property
The Home Valuation Report is an in-depth analysis detailing your home's value as well as a comparison with similar homes in the area
Home Values in the Area
Average Home Value in this Area
Purchase History
| Date | Buyer | Sale Price | Title Company |
|---|---|---|---|
| Cotten Teresa Marie | -- | None Listed On Document | |
| John And Janet Riggle Revocable Living Trust | -- | None Listed On Document | |
| Riggle Janet Marie | -- | Amrock Inc | |
| Riggle Janet Marie | -- | None Available | |
| Riggle John William | -- | None Available |
Source: Public Records
Mortgage History
| Date | Status | Borrower | Loan Amount |
|---|---|---|---|
| Previous Owner | Riggle Janet Marie | $162,258 |
Source: Public Records
Tax History Compared to Growth
Tax History
| Year | Tax Paid | Tax Assessment Tax Assessment Total Assessment is a certain percentage of the fair market value that is determined by local assessors to be the total taxable value of land and additions on the property. | Land | Improvement |
|---|---|---|---|---|
| 2024 | $893 | $197,000 | $40,900 | $156,100 |
| 2023 | $893 | $196,100 | $40,900 | $155,200 |
| 2022 | $797 | $185,900 | $40,900 | $145,000 |
| 2021 | $846 | $185,100 | $40,900 | $144,200 |
| 2020 | $724 | $185,200 | $40,900 | $144,300 |
| 2019 | $692 | $185,200 | $40,900 | $144,300 |
| 2018 | $574 | $159,400 | $40,900 | $118,500 |
| 2017 | $198 | $119,300 | $31,700 | $87,600 |
| 2016 | $196 | $119,400 | $31,700 | $87,700 |
| 2014 | $206 | $118,400 | $31,700 | $86,700 |
| 2013 | -- | $119,300 | $31,700 | $87,600 |
Source: Public Records
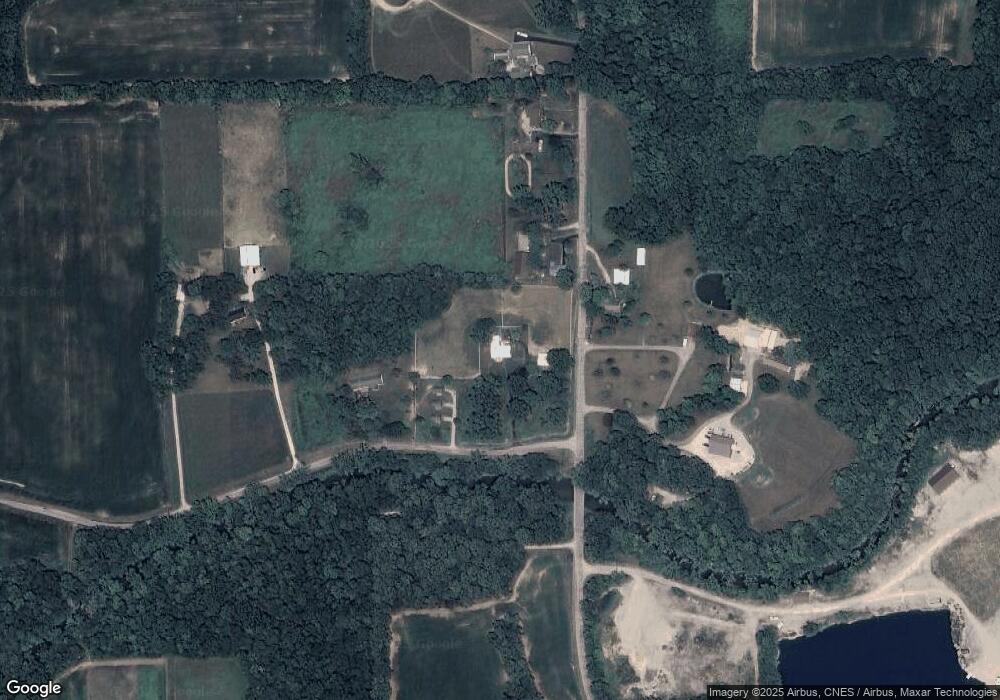
Map
Nearby Homes
- 305 N West St
- 2361 W Broadway
- 1758 N Lancer St
- Elm Street S 1100 St S
- 4189 U S 31
- 2943 Travis St
- 2031 Shaw Ave
- 1352 W 400 S
- 3210 Schilling St
- 2940 W 400 S
- 4364 W 500 S
- 6559 S Abbi Ct
- 39033 Edwards Ct
- Lot 15 W Barberry Ln
- Lot 14 W Barberry Ln Unit 14
- 2792 W 300 S
- 9934 S 150 W
- 2893 S Us Route 31
- 3047 S Wallick Rd
- 2573 S 300 W