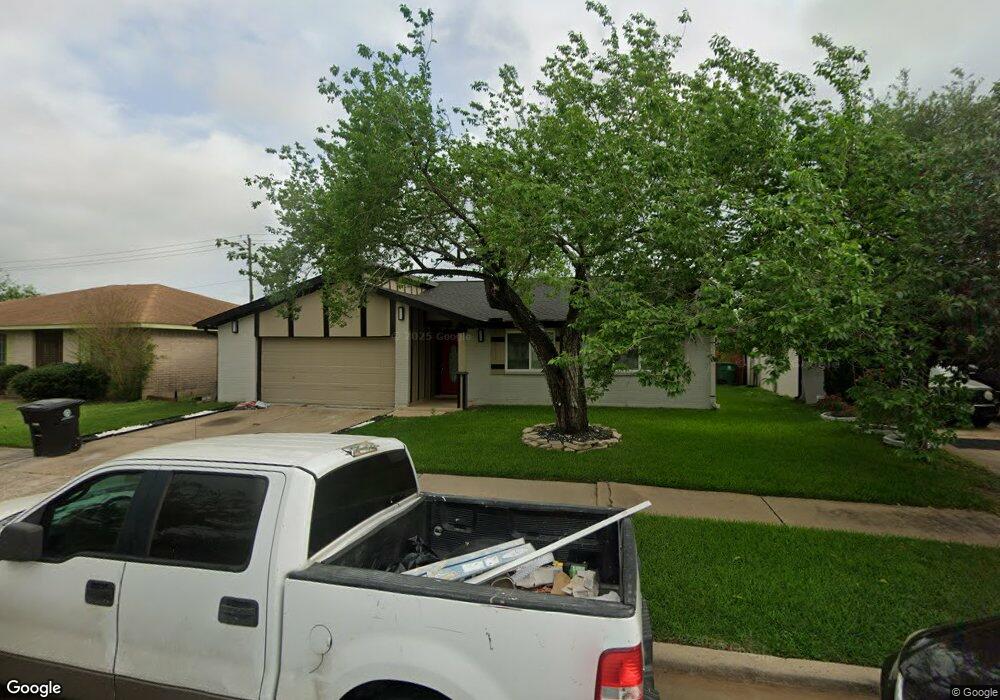
6406 Bazel Brook Dr Missouri City, TX 77489
Fort Bend Houston NeighborhoodEstimated Value: $216,000 - $236,000
3
Beds
2
Baths
1,488
Sq Ft
$151/Sq Ft
Est. Value
About This Home
This home is located at 6406 Bazel Brook Dr, Missouri City, TX 77489 and is currently estimated at $224,152, approximately $150 per square foot. 6406 Bazel Brook Dr is a home located in Fort Bend County with nearby schools including Briargate Elementary School, Blue Ridge Elementary School, and Christa McAuliffe Middle School.
Ownership History
Date
Name
Owned For
Owner Type
Purchase Details
Closed on
Mar 11, 2020
Sold by
J P Rei Solutions Llc
Bought by
Aguirre Elias and Medina Rocio
Current Estimated Value
Home Financials for this Owner
Home Financials are based on the most recent Mortgage that was taken out on this home.
Original Mortgage
$115,000
Outstanding Balance
$101,849
Interest Rate
3.5%
Mortgage Type
New Conventional
Estimated Equity
$122,303
Purchase Details
Closed on
Jun 21, 2019
Sold by
Agrawal Hari P and Agrawal Anjali
Bought by
J P Rei Solutions Llc
Home Financials for this Owner
Home Financials are based on the most recent Mortgage that was taken out on this home.
Original Mortgage
$105,000
Interest Rate
4.1%
Mortgage Type
Purchase Money Mortgage
Purchase Details
Closed on
Feb 11, 1988
Sold by
Hud
Bought by
Agrawal Hari P and Agrawal Anjali
Create a Home Valuation Report for This Property
The Home Valuation Report is an in-depth analysis detailing your home's value as well as a comparison with similar homes in the area
Home Values in the Area
Average Home Value in this Area
Purchase History
| Date | Buyer | Sale Price | Title Company |
|---|---|---|---|
| Aguirre Elias | -- | Fidelity National Title | |
| J P Rei Solutions Llc | -- | Fidelity National Title | |
| Agrawal Hari P | -- | -- |
Source: Public Records
Mortgage History
| Date | Status | Borrower | Loan Amount |
|---|---|---|---|
| Open | Aguirre Elias | $115,000 | |
| Previous Owner | J P Rei Solutions Llc | $105,000 |
Source: Public Records
Tax History Compared to Growth
Tax History
| Year | Tax Paid | Tax Assessment Tax Assessment Total Assessment is a certain percentage of the fair market value that is determined by local assessors to be the total taxable value of land and additions on the property. | Land | Improvement |
|---|---|---|---|---|
| 2025 | $4,122 | $202,902 | $64,529 | $138,373 |
| 2024 | $4,122 | $213,764 | $64,529 | $149,235 |
| 2023 | $4,355 | $223,627 | $49,638 | $173,989 |
| 2022 | $4,296 | $202,710 | $33,390 | $169,320 |
| 2021 | $3,265 | $147,500 | $22,560 | $124,940 |
| 2020 | $2,991 | $132,630 | $22,560 | $110,070 |
| 2019 | $3,055 | $128,760 | $22,560 | $106,200 |
| 2018 | $2,606 | $109,820 | $19,000 | $90,820 |
| 2017 | $2,629 | $109,510 | $19,000 | $90,510 |
| 2016 | $2,406 | $100,230 | $19,000 | $81,230 |
| 2015 | $1,586 | $86,880 | $19,000 | $67,880 |
| 2014 | $733 | $70,320 | $19,000 | $51,320 |
Source: Public Records
Map
Nearby Homes
- 15610 Briar Spring Ct
- 15615 Raven Trail
- 15318 Corsair Rd
- 15806 Corsair Rd
- 15734 Briargate Ct
- 6618 Castleview Ln
- 6619 Indian Lake Dr
- 6101 Maywood Dr
- 15770 Chimney Rock Rd
- 0 Brooklawn Dr Unit 98139376
- 6626 Roberson St
- 6734 Indian Lake Dr
- 6814 Indian Falls Dr
- 15823 Kueben Ln
- 6911 Briargate Dr
- 5710 W Ridgecreek Dr
- 5734 Arthington St
- 6918 Thornwild Rd
- 6623 Maczali Dr
- 6835 Laughlin Dr
- 6410 Bazel Brook Dr
- 6402 Bazel Brook Dr
- 6414 Bazel Brook Dr
- 6407 Bazel Brook Dr
- 6403 Bazel Brook Dr
- 6418 Bazel Brook Dr
- 6411 Bazel Brook Dr
- 6415 Bazel Brook Dr
- 6422 Bazel Brook Dr
- 6419 Bazel Brook Dr
- 6402 Summer Ridge Dr
- 6406 Summer Ridge Dr
- 6403 W Fuqua Dr
- 6407 W Fuqua Dr
- 6410 Summer Ridge Dr
- 6426 Bazel Brook Dr
- 6423 Bazel Brook Dr
- 6414 Summer Ridge Dr
- 6415 W Fuqua Dr
- 6418 Summer Ridge Dr