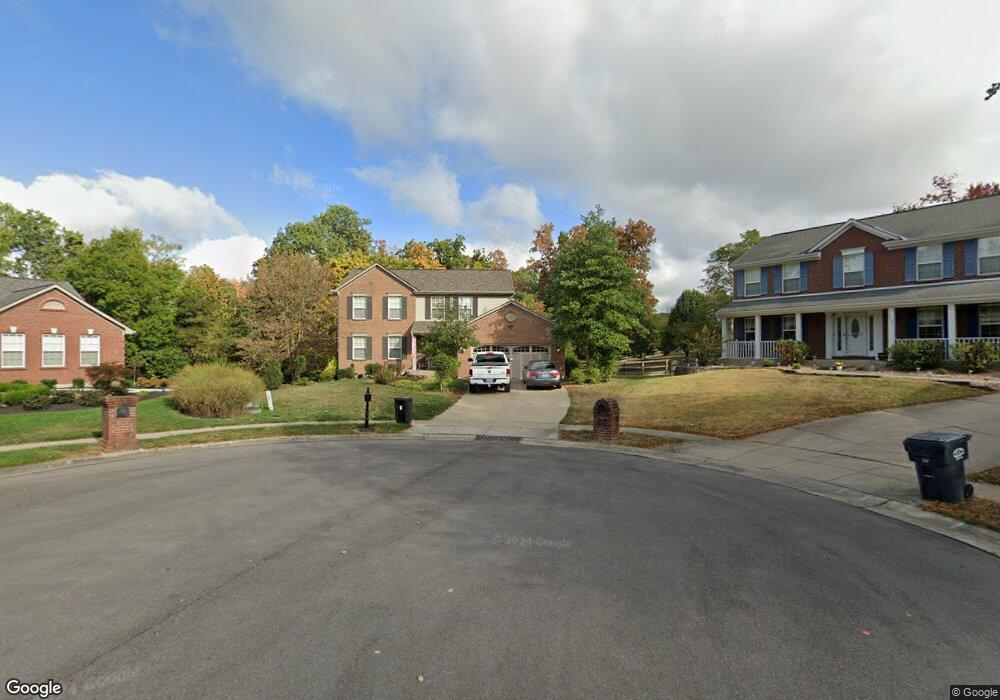
6406 Hawks Nest Ct Burlington, KY 41005
Estimated Value: $367,000 - $394,969
4
Beds
4
Baths
3,092
Sq Ft
$123/Sq Ft
Est. Value
About This Home
This home is located at 6406 Hawks Nest Ct, Burlington, KY 41005 and is currently estimated at $378,992, approximately $122 per square foot. 6406 Hawks Nest Ct is a home located in Boone County with nearby schools including Burlington Elementary School, Camp Ernst Middle School, and Randall K. Cooper High School.
Ownership History
Date
Name
Owned For
Owner Type
Purchase Details
Closed on
Dec 15, 2014
Sold by
Wainscott Cullen D and Wainscott Jessica R
Bought by
Heimbrock John G
Current Estimated Value
Home Financials for this Owner
Home Financials are based on the most recent Mortgage that was taken out on this home.
Original Mortgage
$202,000
Outstanding Balance
$155,582
Interest Rate
4.07%
Mortgage Type
New Conventional
Estimated Equity
$223,410
Purchase Details
Closed on
May 27, 2005
Sold by
Kopplin Chad and Kopplin Robyn N
Bought by
Wainscott Cullen D and Aumbiel Jessica R
Home Financials for this Owner
Home Financials are based on the most recent Mortgage that was taken out on this home.
Original Mortgage
$153,000
Interest Rate
5.8%
Mortgage Type
New Conventional
Purchase Details
Closed on
Sep 6, 2002
Sold by
Arlinghaus Builders Inc
Bought by
Kopplin Chad and Kopplin Robyn N
Home Financials for this Owner
Home Financials are based on the most recent Mortgage that was taken out on this home.
Original Mortgage
$189,053
Interest Rate
6.31%
Mortgage Type
New Conventional
Create a Home Valuation Report for This Property
The Home Valuation Report is an in-depth analysis detailing your home's value as well as a comparison with similar homes in the area
Home Values in the Area
Average Home Value in this Area
Purchase History
| Date | Buyer | Sale Price | Title Company |
|---|---|---|---|
| Heimbrock John G | $212,710 | Sterling Land Title Agency I | |
| Wainscott Cullen D | $213,000 | Advanced Land Title Agency | |
| Kopplin Chad | $194,900 | -- |
Source: Public Records
Mortgage History
| Date | Status | Borrower | Loan Amount |
|---|---|---|---|
| Open | Heimbrock John G | $202,000 | |
| Previous Owner | Wainscott Cullen D | $153,000 | |
| Previous Owner | Kopplin Chad | $189,053 |
Source: Public Records
Tax History Compared to Growth
Tax History
| Year | Tax Paid | Tax Assessment Tax Assessment Total Assessment is a certain percentage of the fair market value that is determined by local assessors to be the total taxable value of land and additions on the property. | Land | Improvement |
|---|---|---|---|---|
| 2024 | $3,118 | $283,500 | $40,000 | $243,500 |
| 2023 | $2,512 | $225,700 | $40,000 | $185,700 |
| 2022 | $2,523 | $225,700 | $40,000 | $185,700 |
| 2021 | $2,603 | $225,700 | $40,000 | $185,700 |
| 2020 | $2,573 | $225,700 | $40,000 | $185,700 |
| 2019 | $2,443 | $212,710 | $36,000 | $176,710 |
| 2018 | $2,481 | $212,710 | $36,000 | $176,710 |
| 2017 | $2,421 | $212,710 | $36,000 | $176,710 |
| 2015 | $2,404 | $212,710 | $36,000 | $176,710 |
| 2013 | -- | $176,900 | $36,000 | $140,900 |
Source: Public Records
Map
Nearby Homes
- 2732 Coachlight Ln
- 6319 Cinnamon Ridge Dr
- 6308 Cinnamon Ridge Dr
- 6301 Remington Cove
- 6547 Oak Crest Dr
- 2964 Holly Hill Dr
- 6540 Oak Crest Dr
- 3076 Featherstone Dr
- 6677 Rogers Ln
- 2638 Castle Ct
- 6710 Deerberry Ct
- 6682 Alder Ct
- 7620 E Bend Rd
- 6766 Camp Ernst Rd
- 2110 Bluegrama Dr
- 4467 Hackberry Ct
- 5805 Stillwater Ln
- 2503 Winner's Post Way
- 2516 Winners Post Way
- VANDERBURGH Plan at Stillwater
- 6402 Hawks Nest Ct
- 6403 Hawks Nest Ct
- 2663 Granite Pass
- 6399 Hawks Nest Ct
- 2666 Granite Pass
- 6398 Hawks Nest Ct
- 2657 Granite Pass
- 6383 Hawks Nest Ct
- 6357 Hawks Nest Ct
- 6394 Hawks Nest Ct
- 6361 Hawks Nest Ct
- 2662 Granite Pass
- 2653 Granite Pass
- 6369 Hawks Nest Ct
- 2820 Burnside Dr
- 2658 Granite Pass
- 2816 Burnside Dr
- 492 Hawks Nest Ct
- 494 Hawks Nest Ct
- 655 Hawks Nest Ct