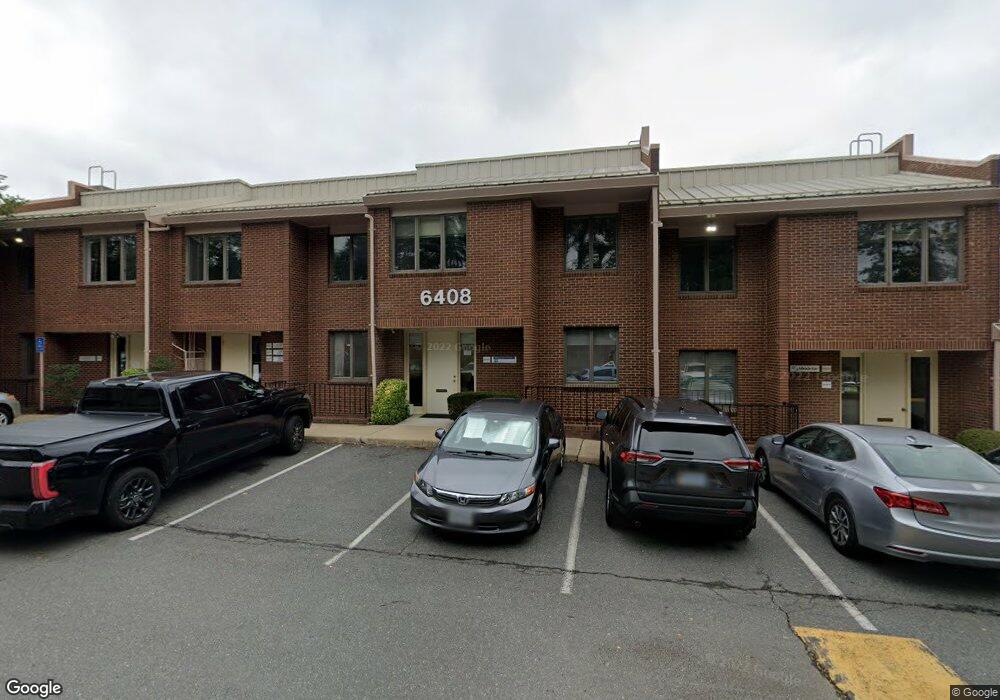
6408-C Seven Corners Place Falls Church, VA 22044
Estimated Value: $400,036
--
Bed
--
Bath
825
Sq Ft
$485/Sq Ft
Est. Value
About This Home
This home is located at 6408-C Seven Corners Place, Falls Church, VA 22044 and is currently estimated at $400,036, approximately $484 per square foot. 6408-C Seven Corners Place is a home located in Fairfax County with nearby schools including Sleepy Hollow Elementary School, Glasgow Middle School, and Justice High School.
Ownership History
Date
Name
Owned For
Owner Type
Purchase Details
Closed on
Jun 15, 2020
Sold by
Fairfax Clinic Properties Llc
Bought by
B5 Realty Llc
Current Estimated Value
Home Financials for this Owner
Home Financials are based on the most recent Mortgage that was taken out on this home.
Original Mortgage
$232,000
Outstanding Balance
$119,449
Interest Rate
3.2%
Mortgage Type
New Conventional
Estimated Equity
$280,587
Purchase Details
Closed on
Nov 6, 2015
Sold by
Nguyen Nga Tiu
Bought by
Fairfax Clinic Properties Llc
Home Financials for this Owner
Home Financials are based on the most recent Mortgage that was taken out on this home.
Original Mortgage
$204,000
Interest Rate
3.88%
Mortgage Type
New Conventional
Create a Home Valuation Report for This Property
The Home Valuation Report is an in-depth analysis detailing your home's value as well as a comparison with similar homes in the area
Home Values in the Area
Average Home Value in this Area
Purchase History
| Date | Buyer | Sale Price | Title Company |
|---|---|---|---|
| B5 Realty Llc | $290,000 | Title 1 Llc | |
| Fairfax Clinic Properties Llc | $255,000 | Metropolis Title |
Source: Public Records
Mortgage History
| Date | Status | Borrower | Loan Amount |
|---|---|---|---|
| Open | B5 Realty Llc | $232,000 | |
| Previous Owner | Fairfax Clinic Properties Llc | $204,000 |
Source: Public Records
Tax History Compared to Growth
Tax History
| Year | Tax Paid | Tax Assessment Tax Assessment Total Assessment is a certain percentage of the fair market value that is determined by local assessors to be the total taxable value of land and additions on the property. | Land | Improvement |
|---|---|---|---|---|
| 2025 | $3,568 | $273,900 | $54,780 | $219,120 |
| 2024 | $3,568 | $273,900 | $54,780 | $219,120 |
| 2023 | $3,466 | $273,900 | $54,780 | $219,120 |
| 2022 | $3,011 | $235,130 | $47,030 | $188,100 |
| 2021 | $3,081 | $235,130 | $47,030 | $188,100 |
| 2020 | $3,105 | $235,130 | $47,030 | $188,100 |
| 2019 | $3,105 | $235,130 | $47,030 | $188,100 |
| 2018 | $2,704 | $235,130 | $47,030 | $188,100 |
| 2017 | $3,279 | $252,450 | $50,490 | $201,960 |
| 2016 | $3,278 | $252,450 | $50,490 | $201,960 |
| 2015 | $3,171 | $252,450 | $50,490 | $201,960 |
| 2014 | $3,164 | $252,450 | $50,490 | $201,960 |
Source: Public Records
Map
Nearby Homes
- 3005 Seven Oaks Place
- 6416 Seven Oaks Ct
- 6424 South St
- 3035 Hazelton St
- 911 Hillwood Ave
- 2915 Meadow Ln
- 3106 Juniper Ln
- 2839 Meadow Ln
- 3110 Juniper Ln
- 997 N Sycamore St
- 1000 N Sycamore St
- 600 Roosevelt Blvd Unit 314
- 3076 Patrick Henry Dr Unit 202
- 1008 N Roosevelt St
- 3108 Juniper Ln
- 889 N Manchester St
- 6282 15th Rd N
- 880 N Madison St
- 2818 Liberty Ave
- 2821 Douglass Ave
- 6408-G Seven Corners Place
- 6408 Seven Corners Place Unit 3P
- 6408 Seven Corners Place Unit P
- 6408 Seven Corners Place Unit F
- 6408 Seven Corners Place Unit 3J
- 6408 Seven Corners Place Unit 3D
- 6408 Seven Corners Place Unit 3C
- 6408 Seven Corners Place Unit K
- 6408g Seven Corners Place
- 6408-R Seven Corners Place
- 6408-B Seven Corners Place
- 6408 Seven Corners Place Unit 3K
- 6408 Seven Corners Place Unit 3K
- 6408 Seven Corners Place
- 6408 D Seven Corners Place Unit 3D & 3E
- 6408-P Seven Corners Place
- 6408-N Seven Corners Place
- 6408-M Seven Corners Place
- 6408-L Seven Corners Place
- 6408-K Seven Corners Place