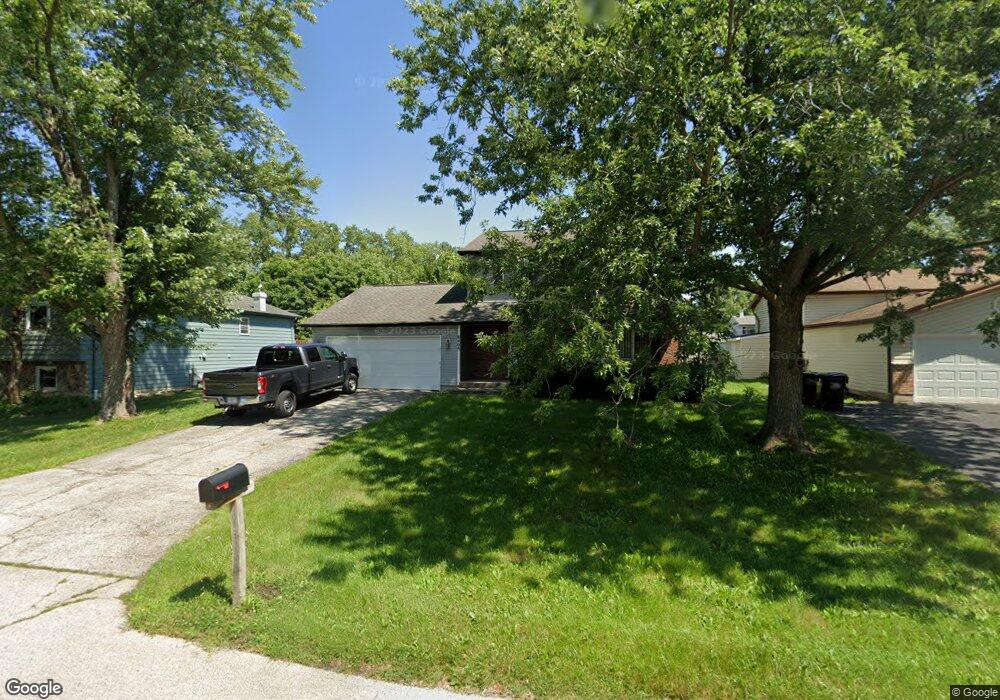
6408 John St Unit 1 Crystal Lake, IL 60014
Estimated Value: $333,000 - $355,000
3
Beds
3
Baths
1,671
Sq Ft
$205/Sq Ft
Est. Value
About This Home
This home is located at 6408 John St Unit 1, Crystal Lake, IL 60014 and is currently estimated at $342,332, approximately $204 per square foot. 6408 John St Unit 1 is a home located in McHenry County with nearby schools including West Elementary School, Richard F Bernotas Middle School, and Crystal Lake Central High School.
Ownership History
Date
Name
Owned For
Owner Type
Purchase Details
Closed on
Mar 1, 2000
Sold by
Hud
Bought by
Brzica David F
Current Estimated Value
Purchase Details
Closed on
Jul 28, 1999
Sold by
Mikals
Bought by
Hud
Purchase Details
Closed on
Jan 8, 1997
Sold by
Woodall Tommy K and Woodall Tommy Kent
Bought by
Mikals John L and Mikals Lana M
Home Financials for this Owner
Home Financials are based on the most recent Mortgage that was taken out on this home.
Original Mortgage
$144,172
Interest Rate
7.58%
Mortgage Type
FHA
Purchase Details
Closed on
Mar 23, 1995
Sold by
Joesel James W and Joesel Christine C
Bought by
Woodall Tommy K and Woodall Deborah J
Home Financials for this Owner
Home Financials are based on the most recent Mortgage that was taken out on this home.
Original Mortgage
$127,800
Interest Rate
8.82%
Create a Home Valuation Report for This Property
The Home Valuation Report is an in-depth analysis detailing your home's value as well as a comparison with similar homes in the area
Home Values in the Area
Average Home Value in this Area
Purchase History
| Date | Buyer | Sale Price | Title Company |
|---|---|---|---|
| Brzica David F | $121,106 | Stewart Title Company | |
| Hud | -- | Wheatland Title | |
| Mikals John L | $147,000 | Universal Title Services Inc | |
| Woodall Tommy K | $142,000 | -- |
Source: Public Records
Mortgage History
| Date | Status | Borrower | Loan Amount |
|---|---|---|---|
| Previous Owner | Mikals John L | $144,172 | |
| Previous Owner | Woodall Tommy K | $127,800 |
Source: Public Records
Tax History Compared to Growth
Tax History
| Year | Tax Paid | Tax Assessment Tax Assessment Total Assessment is a certain percentage of the fair market value that is determined by local assessors to be the total taxable value of land and additions on the property. | Land | Improvement |
|---|---|---|---|---|
| 2024 | $6,958 | $91,747 | $7,919 | $83,828 |
| 2023 | $6,793 | $82,418 | $7,114 | $75,304 |
| 2022 | $6,330 | $75,048 | $6,478 | $68,570 |
| 2021 | $6,062 | $70,680 | $6,101 | $64,579 |
| 2020 | $6,001 | $68,795 | $5,938 | $62,857 |
| 2019 | $5,914 | $67,038 | $5,786 | $61,252 |
| 2018 | $5,286 | $58,330 | $5,363 | $52,967 |
| 2017 | $5,278 | $54,971 | $5,054 | $49,917 |
| 2016 | $5,031 | $49,988 | $4,805 | $45,183 |
| 2013 | -- | $51,662 | $10,527 | $41,135 |
Source: Public Records
Map
Nearby Homes
- 1398 Floresta Vista
- 110 Delaware St
- 1393 Mulberry Ln
- Lots 21-23 Corrine Ave
- Lots 15-17 Corrine Ave
- 107 Georgine St
- 9140 Selkirk Ct
- Lot 16 and 17 Millard Ave
- 9120 Selkirk Ct
- 421 Elmwood Ave
- 8608 Oakwood Dr
- 9640 Stonecastle Ln
- 1358 Cottonwood Ln
- 6165 Stansbury Ln
- 9780 Stonecastle Ln
- 7240 Bannockburn Cir
- 265 Sunset Dr
- 7165 Bannockburn Cir
- 9060 Edinburgh Ct
- 1356 Coronado Vista