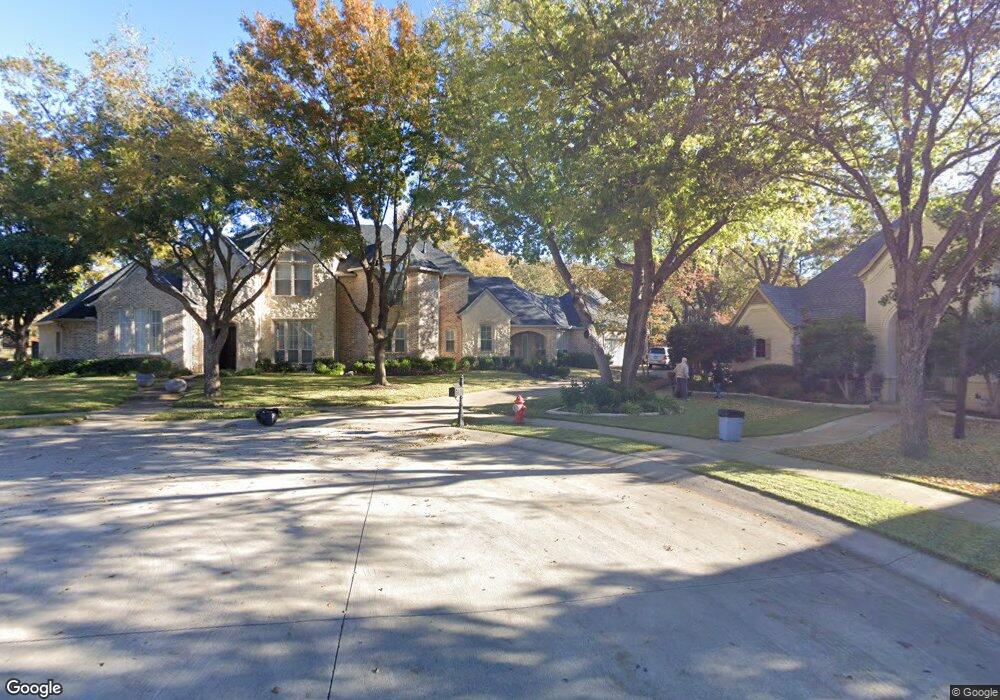
6408 Kentucky Ct Colleyville, TX 76034
Estimated Value: $1,072,149 - $1,139,000
4
Beds
4
Baths
4,003
Sq Ft
$274/Sq Ft
Est. Value
About This Home
This home is located at 6408 Kentucky Ct, Colleyville, TX 76034 and is currently estimated at $1,098,787, approximately $274 per square foot. 6408 Kentucky Ct is a home located in Tarrant County with nearby schools including Liberty Elementary School, Bear Creek Intermediate School, and Keller Middle School.
Ownership History
Date
Name
Owned For
Owner Type
Purchase Details
Closed on
Dec 12, 2007
Sold by
Arrocha Charlotte
Bought by
Arrocha Roberto
Current Estimated Value
Home Financials for this Owner
Home Financials are based on the most recent Mortgage that was taken out on this home.
Original Mortgage
$275,000
Outstanding Balance
$172,914
Interest Rate
6.26%
Mortgage Type
Credit Line Revolving
Estimated Equity
$925,873
Purchase Details
Closed on
Sep 20, 1999
Sold by
P H Designs Corp
Bought by
Arrocha Charlotte and Arrocha Roberto
Home Financials for this Owner
Home Financials are based on the most recent Mortgage that was taken out on this home.
Original Mortgage
$240,000
Interest Rate
8.18%
Purchase Details
Closed on
Mar 26, 1998
Sold by
Foxcreek Residential Development Ltd
Bought by
P H Designs Corp
Create a Home Valuation Report for This Property
The Home Valuation Report is an in-depth analysis detailing your home's value as well as a comparison with similar homes in the area
Home Values in the Area
Average Home Value in this Area
Purchase History
| Date | Buyer | Sale Price | Title Company |
|---|---|---|---|
| Arrocha Roberto | -- | United Title Of Texas | |
| Arrocha Charlotte | -- | American Title | |
| P H Designs Corp | -- | American Title |
Source: Public Records
Mortgage History
| Date | Status | Borrower | Loan Amount |
|---|---|---|---|
| Open | Arrocha Roberto | $275,000 | |
| Previous Owner | Arrocha Charlotte | $240,000 |
Source: Public Records
Tax History Compared to Growth
Tax History
| Year | Tax Paid | Tax Assessment Tax Assessment Total Assessment is a certain percentage of the fair market value that is determined by local assessors to be the total taxable value of land and additions on the property. | Land | Improvement |
|---|---|---|---|---|
| 2025 | $12,162 | $890,000 | $225,250 | $664,750 |
| 2024 | $12,162 | $939,601 | $225,250 | $714,351 |
| 2023 | $14,926 | $962,486 | $225,250 | $737,236 |
| 2022 | $15,531 | $823,628 | $225,250 | $598,378 |
| 2021 | $15,257 | $673,578 | $200,000 | $473,578 |
| 2020 | $13,967 | $606,282 | $200,000 | $406,282 |
| 2019 | $14,704 | $606,282 | $200,000 | $406,282 |
| 2018 | $11,829 | $580,000 | $150,000 | $430,000 |
| 2017 | $14,660 | $589,758 | $150,000 | $439,758 |
| 2016 | $13,338 | $584,148 | $150,000 | $434,148 |
| 2015 | $12,146 | $487,800 | $65,000 | $422,800 |
| 2014 | $12,146 | $487,800 | $65,000 | $422,800 |
Source: Public Records
Map
Nearby Homes
- 203 Polo Trail
- 6776 St Moritz Pkwy
- 803 Marie Dr
- 6004 Hunter Ct
- 6108 Westcoat Dr
- 1010 W Mcdonwell School Rd
- 613 Colts Neck Ct
- 912 Chateau Ct
- 6401 Westcoat Dr
- 204 Old Grove Rd
- 6809 Strauss
- 6112 Emmas Ct
- 6912 Handel
- 5800 Hunter Trail
- 5803 Chalford Common
- 5918 Crescent Ln
- 5903 Crescent Ln
- 7115 Cast Iron Forest Trail
- 200 Valley View Dr N
- 5913 Preston Way
- 6405 Kentucky Ct
- 6404 Kentucky Ct
- 6414 Champion Way
- 6410 Champion Way
- 6418 Champion Way
- 6401 Kentucky Ct
- 6406 Champion Way
- 6400 Kentucky Ct
- 6402 Champion Way
- 6500 Champion Way
- 6405 Remington Pkwy
- 320 Polo Trail
- 6504 Champion Way
- 6411 Champion Way
- 6312 Remington Pkwy
- 6409 Remington Pkwy
- 6419 Champion Way
- 6403 Champion Way
- 316 Polo Trail
- 6413 Remington Pkwy