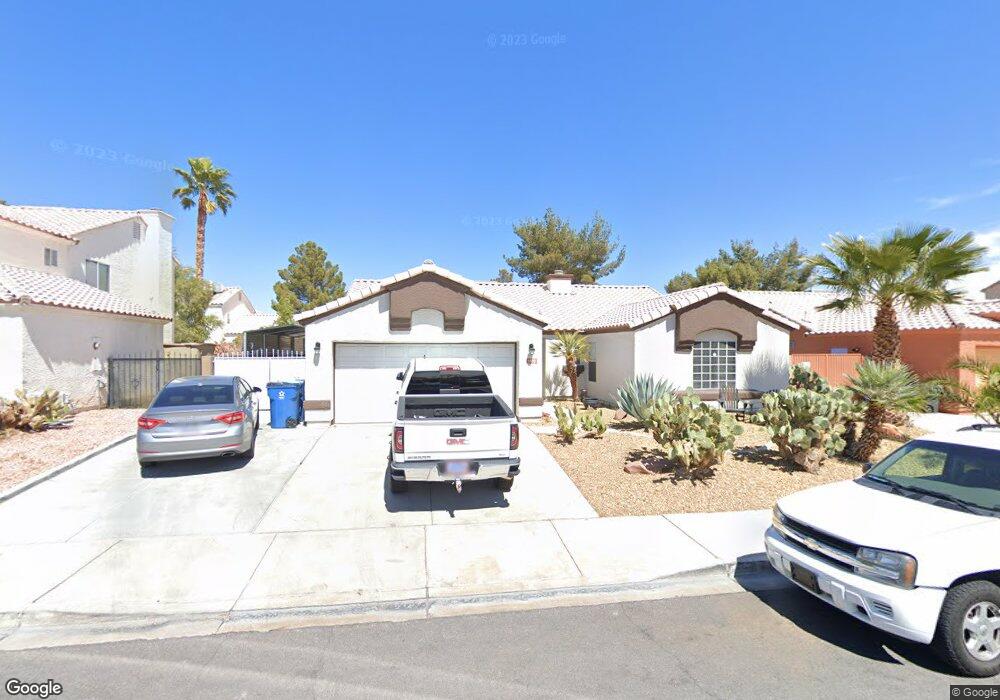
6408 Quantum Ln Las Vegas, NV 89130
North Cheyenne NeighborhoodEstimated Value: $402,250 - $428,000
3
Beds
2
Baths
1,604
Sq Ft
$259/Sq Ft
Est. Value
About This Home
This home is located at 6408 Quantum Ln, Las Vegas, NV 89130 and is currently estimated at $415,813, approximately $259 per square foot. 6408 Quantum Ln is a home located in Clark County with nearby schools including Ernest May Elementary School, Theron L Swainston Middle School, and Shadow Ridge High School.
Ownership History
Date
Name
Owned For
Owner Type
Purchase Details
Closed on
Mar 1, 2012
Sold by
Salami George
Bought by
Salami George Dib and The George Dib Salami Revocable Living T
Current Estimated Value
Purchase Details
Closed on
Mar 13, 2008
Sold by
Salami George Dib
Bought by
Salami George Dib and The George Dib Salami Revocable Living T
Purchase Details
Closed on
Nov 29, 2005
Sold by
Salami George and Salami Susanne J
Bought by
Salami George Dib
Purchase Details
Closed on
May 2, 2005
Sold by
Salami Dib and Salami Carolyn
Bought by
Salami George and Salami Susanne
Purchase Details
Closed on
Jul 22, 2002
Sold by
Hildebrandt Mary C
Bought by
Salami Dib and Salami Carolyn
Home Financials for this Owner
Home Financials are based on the most recent Mortgage that was taken out on this home.
Original Mortgage
$153,900
Interest Rate
6.51%
Create a Home Valuation Report for This Property
The Home Valuation Report is an in-depth analysis detailing your home's value as well as a comparison with similar homes in the area
Home Values in the Area
Average Home Value in this Area
Purchase History
| Date | Buyer | Sale Price | Title Company |
|---|---|---|---|
| Salami George Dib | -- | None Available | |
| Salami George Dib | -- | None Available | |
| Salami George Dib | -- | Equity Title Of Nevada | |
| Salami George | $305,000 | Equity Title Of Nevada | |
| Salami Dib | $162,000 | Old Republic Title Company |
Source: Public Records
Mortgage History
| Date | Status | Borrower | Loan Amount |
|---|---|---|---|
| Previous Owner | Salami Dib | $153,900 |
Source: Public Records
Tax History Compared to Growth
Tax History
| Year | Tax Paid | Tax Assessment Tax Assessment Total Assessment is a certain percentage of the fair market value that is determined by local assessors to be the total taxable value of land and additions on the property. | Land | Improvement |
|---|---|---|---|---|
| 2025 | $1,705 | $86,935 | $32,550 | $54,385 |
| 2024 | $1,655 | $86,935 | $32,550 | $54,385 |
| 2023 | $1,655 | $82,599 | $30,450 | $52,149 |
| 2022 | $1,762 | $77,227 | $29,400 | $47,827 |
| 2021 | $1,632 | $75,062 | $29,400 | $45,662 |
| 2020 | $1,512 | $67,136 | $21,700 | $45,436 |
| 2019 | $1,417 | $65,591 | $20,650 | $44,941 |
| 2018 | $1,352 | $60,281 | $16,800 | $43,481 |
| 2017 | $2,000 | $61,006 | $16,800 | $44,206 |
| 2016 | $1,267 | $56,361 | $11,550 | $44,811 |
| 2015 | $1,263 | $43,351 | $8,750 | $34,601 |
| 2014 | $1,226 | $36,298 | $8,750 | $27,548 |
Source: Public Records
Map
Nearby Homes
- 6505 Quantum Ln
- 5005 Chambliss Dr
- 5041 Peaceful Paradise St
- 6540 Angel Mountain Ave Unit 2
- 5059 Tranquil View St
- 6458 Secret Grove Ave
- 6507 Dove Point Place
- 6406 Veranda Falls Ct
- 6277 Kraft Ave
- 6225 Minerva Dr
- 5144 Maverick St
- 6256 Hill Haven Ave
- 6636 Painted Desert Dr
- 6608 Messenger Ct
- 4517 Carbine Chapel St
- 6425 Wheelbarrow Peak Dr
- 5329 Bright Sun Ct
- 5620 N Jones Blvd
- 6105 Sadler Dr
- 4505 Truscott Ct
- 6412 Quantum Ln
- 6404 Quantum Ln
- 6409 Cosmo Ln
- 6405 Cosmo Ln
- 6416 Quantum Ln
- 6400 Quantum Ln
- 6409 Quantum Ln
- 6401 Cosmo Ln
- 6413 Quantum Ln
- 6417 Cosmo Ln
- 6405 Quantum Ln
- 6417 Quantum Ln
- 6420 Quantum Ln
- 6401 Quantum Ln
- 6421 Cosmo Ln
- 6421 Quantum Ln
- 4849 Storm Mountain St
- 6404 Sundown Heights Ave
- 6404 Cosmo Ln