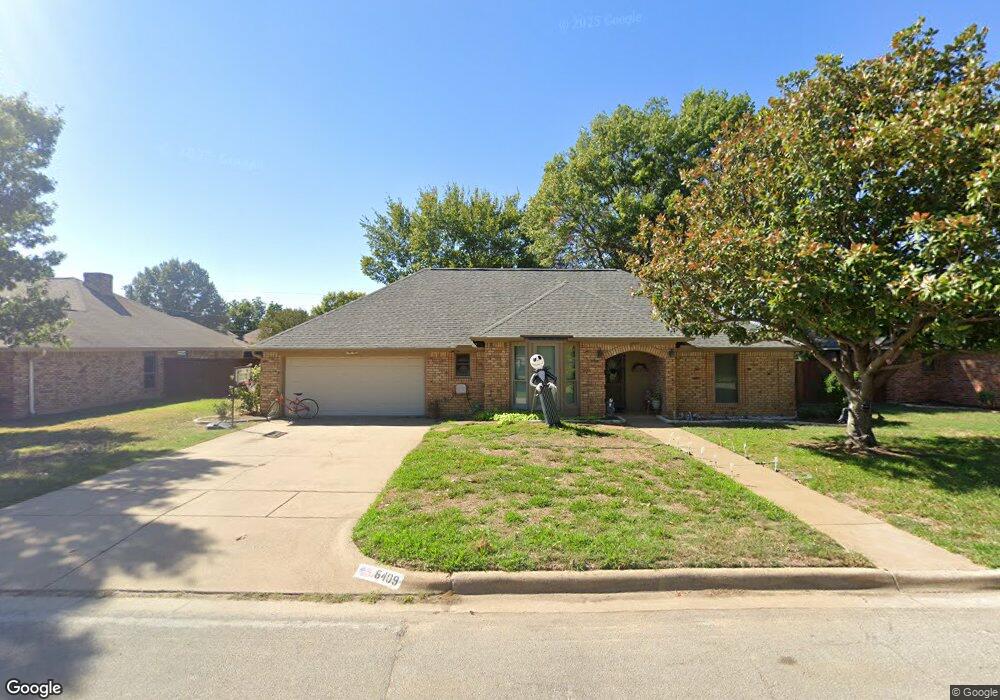
6409 Chilton Dr North Richland Hills, TX 76182
Estimated Value: $348,000 - $364,000
3
Beds
2
Baths
1,658
Sq Ft
$214/Sq Ft
Est. Value
About This Home
This home is located at 6409 Chilton Dr, North Richland Hills, TX 76182 and is currently estimated at $355,162, approximately $214 per square foot. 6409 Chilton Dr is a home located in Tarrant County with nearby schools including Walker Creek Elementary School, Smithfield Middle School, and Birdville High School.
Ownership History
Date
Name
Owned For
Owner Type
Purchase Details
Closed on
Dec 13, 2019
Sold by
Schmidt Brandon L
Bought by
Chaka Tessie
Current Estimated Value
Purchase Details
Closed on
Mar 28, 2005
Sold by
Ragan Sean E and Ragan Jan
Bought by
Schmidt Brandon L
Home Financials for this Owner
Home Financials are based on the most recent Mortgage that was taken out on this home.
Original Mortgage
$108,000
Interest Rate
5.71%
Mortgage Type
Purchase Money Mortgage
Purchase Details
Closed on
Dec 4, 2002
Sold by
Ragan Velecia D
Bought by
Ragan Sean E
Purchase Details
Closed on
Jan 21, 1999
Sold by
Crow Gordon A and Crow Cheryl K
Bought by
Ragan Sean E and Ragan Velecia D
Home Financials for this Owner
Home Financials are based on the most recent Mortgage that was taken out on this home.
Original Mortgage
$102,500
Interest Rate
6.66%
Create a Home Valuation Report for This Property
The Home Valuation Report is an in-depth analysis detailing your home's value as well as a comparison with similar homes in the area
Home Values in the Area
Average Home Value in this Area
Purchase History
| Date | Buyer | Sale Price | Title Company |
|---|---|---|---|
| Chaka Tessie | -- | Republic Title Of Tx | |
| Schmidt Brandon L | -- | American Title | |
| Ragan Sean E | -- | -- | |
| Ragan Sean E | -- | Stewart Title |
Source: Public Records
Mortgage History
| Date | Status | Borrower | Loan Amount |
|---|---|---|---|
| Previous Owner | Schmidt Brandon L | $108,000 | |
| Previous Owner | Ragan Sean E | $102,500 | |
| Closed | Ragan Sean E | $0 | |
| Closed | Schmidt Brandon L | $27,000 |
Source: Public Records
Tax History Compared to Growth
Tax History
| Year | Tax Paid | Tax Assessment Tax Assessment Total Assessment is a certain percentage of the fair market value that is determined by local assessors to be the total taxable value of land and additions on the property. | Land | Improvement |
|---|---|---|---|---|
| 2025 | $5,330 | $335,328 | $93,542 | $241,786 |
| 2024 | $5,330 | $335,328 | $93,542 | $241,786 |
| 2023 | $6,521 | $332,892 | $93,542 | $239,350 |
| 2022 | $6,503 | $275,359 | $40,000 | $235,359 |
| 2021 | $6,252 | $260,797 | $40,000 | $220,797 |
| 2020 | $5,683 | $223,348 | $40,000 | $183,348 |
| 2019 | $4,927 | $224,803 | $40,000 | $184,803 |
| 2018 | $3,769 | $170,102 | $40,000 | $130,102 |
| 2017 | $4,161 | $180,384 | $35,000 | $145,384 |
| 2016 | $3,782 | $161,818 | $17,000 | $144,818 |
| 2015 | $2,900 | $127,800 | $17,000 | $110,800 |
| 2014 | $2,900 | $127,800 | $17,000 | $110,800 |
Source: Public Records
Map
Nearby Homes
- 6509 Paula Ct
- 6432 Brynwyck Ln
- 6505 Parkway Ave
- 8920 Martin Dr
- 6625 Crane Rd
- 6521 Rock Springs Dr
- 8436 Town Walk Dr
- 8421 Randy Dr
- 8420 Town Walk Dr
- 8412 Glenann Dr
- 8409 Main St
- 8409 Glenann Dr
- 8886 Ice House Dr
- 8740 Ice House Dr
- 6704 Nob Hill Ct
- 6708 Nob Hill Ct
- 6801 Woodland Hills Dr
- 6137 Marquita Mews
- 8748 Morris Mews
- 8858 Mandalay St
- 6413 Chilton Dr
- 6405 Chilton Dr
- 6408 Blake Ct
- 6404 Blake Ct
- 6412 Blake Ct
- 6417 Chilton Dr
- 6401 Chilton Dr
- 6408 Chilton Dr
- 6404 Chilton Dr
- 6412 Chilton Dr
- 6416 Blake Ct
- 6400 Blake Ct
- 6400 Chilton Dr
- 6421 Chilton Dr
- 6416 Chilton Dr
- 6420 Blake Ct
- 6409 Blake Ct
- 6420 Chilton Dr
- 6452 Brynwyck Ln
- 6401 Blake Ct