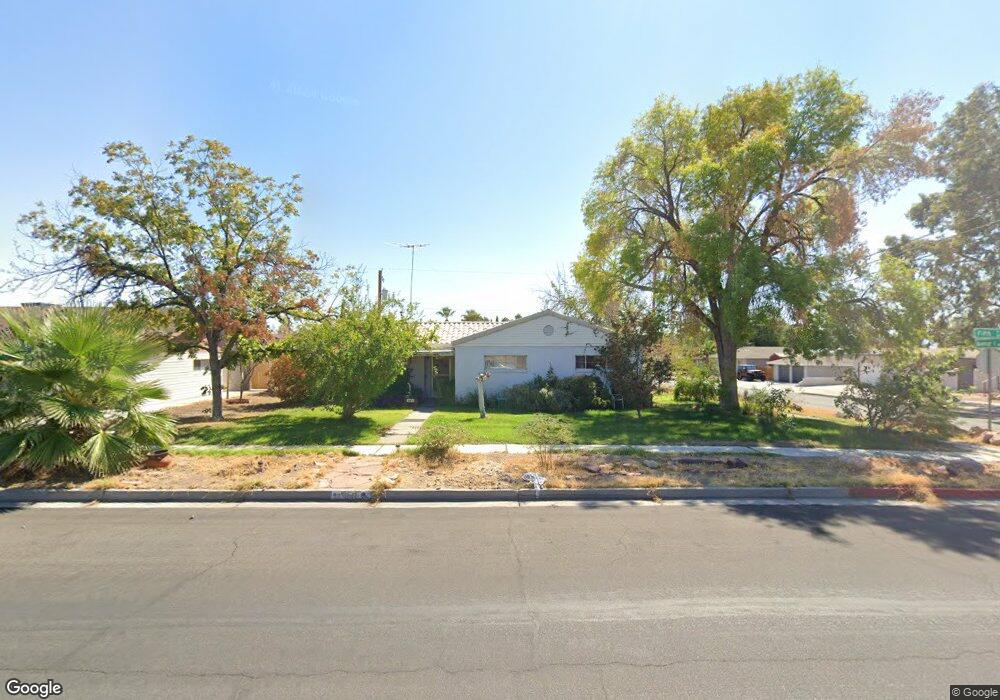
641 5th St Boulder City, NV 89005
Estimated Value: $393,000 - $430,000
3
Beds
1
Bath
1,242
Sq Ft
$337/Sq Ft
Est. Value
About This Home
This home is located at 641 5th St, Boulder City, NV 89005 and is currently estimated at $418,880, approximately $337 per square foot. 641 5th St is a home located in Clark County with nearby schools including Andrew Mitchell Elementary School, Martha P. King Elementary School, and Elton M. & Madelaine E. Garrett Junior High School.
Ownership History
Date
Name
Owned For
Owner Type
Purchase Details
Closed on
May 25, 2010
Sold by
Madsen Cornelia May Bates
Bought by
Madsen Cornelia
Current Estimated Value
Purchase Details
Closed on
Mar 26, 2009
Sold by
Bates Beulah M
Bought by
Bates Beulah M and Beulah M Bates Trust
Home Financials for this Owner
Home Financials are based on the most recent Mortgage that was taken out on this home.
Original Mortgage
$100,000
Interest Rate
5.15%
Mortgage Type
New Conventional
Purchase Details
Closed on
Aug 17, 2001
Sold by
Bates Beulah M
Bought by
Bates Beulah M and Beulah M Bates Trust
Create a Home Valuation Report for This Property
The Home Valuation Report is an in-depth analysis detailing your home's value as well as a comparison with similar homes in the area
Home Values in the Area
Average Home Value in this Area
Purchase History
| Date | Buyer | Sale Price | Title Company |
|---|---|---|---|
| Madsen Cornelia | -- | None Available | |
| Bates Beulah M | -- | Nevada Title Las Vegas | |
| Bates Beulah M | -- | -- |
Source: Public Records
Mortgage History
| Date | Status | Borrower | Loan Amount |
|---|---|---|---|
| Closed | Bates Beulah M | $100,000 |
Source: Public Records
Tax History Compared to Growth
Tax History
| Year | Tax Paid | Tax Assessment Tax Assessment Total Assessment is a certain percentage of the fair market value that is determined by local assessors to be the total taxable value of land and additions on the property. | Land | Improvement |
|---|---|---|---|---|
| 2025 | $1,314 | $77,489 | $56,350 | $21,139 |
| 2024 | $1,217 | $77,489 | $56,350 | $21,139 |
| 2023 | $1,217 | $61,299 | $42,263 | $19,036 |
| 2022 | $1,127 | $55,306 | $38,238 | $17,068 |
| 2021 | $1,043 | $50,867 | $35,018 | $15,849 |
| 2020 | $969 | $48,431 | $33,005 | $15,426 |
| 2019 | $908 | $45,096 | $30,188 | $14,908 |
| 2018 | $866 | $40,176 | $26,163 | $14,013 |
| 2017 | $993 | $38,031 | $24,150 | $13,881 |
| 2016 | $810 | $31,627 | $18,113 | $13,514 |
| 2015 | $809 | $30,425 | $17,325 | $13,100 |
| 2014 | $784 | $30,066 | $17,325 | $12,741 |
Source: Public Records
Map
Nearby Homes