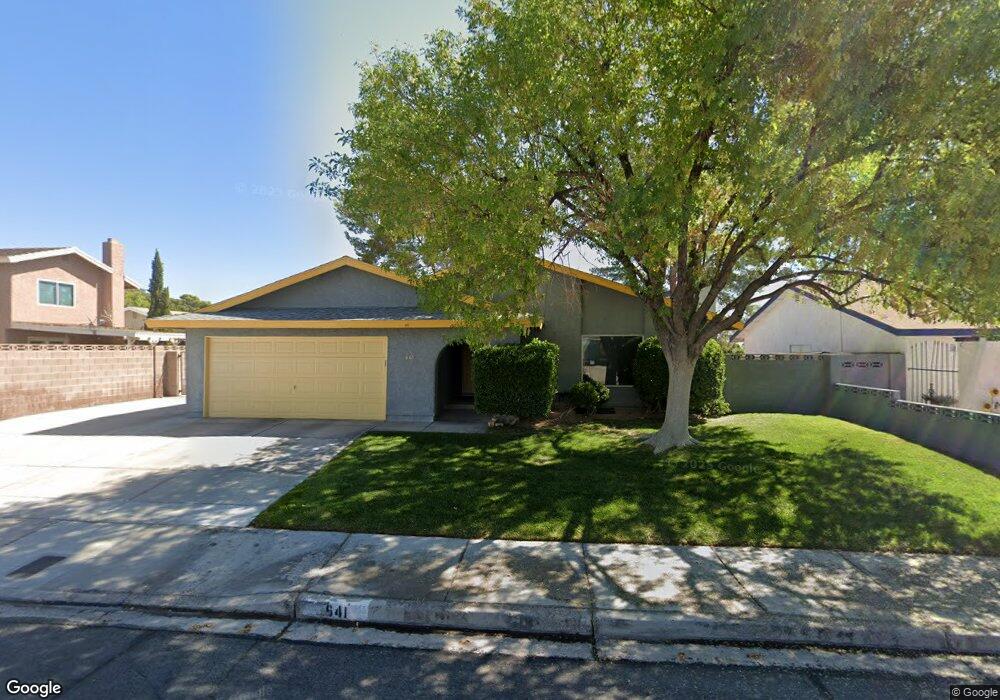
641 Arrayo Way Boulder City, NV 89005
Estimated Value: $402,524 - $471,000
2
Beds
2
Baths
1,154
Sq Ft
$376/Sq Ft
Est. Value
About This Home
This home is located at 641 Arrayo Way, Boulder City, NV 89005 and is currently estimated at $434,381, approximately $376 per square foot. 641 Arrayo Way is a home located in Clark County with nearby schools including Andrew Mitchell Elementary School, Martha P. King Elementary School, and Elton M. & Madelaine E. Garrett Junior High School.
Ownership History
Date
Name
Owned For
Owner Type
Purchase Details
Closed on
May 17, 2021
Sold by
Schulz Roy O and Schulz Judith A
Bought by
Schulz Roy O and Schulz Judith A
Current Estimated Value
Home Financials for this Owner
Home Financials are based on the most recent Mortgage that was taken out on this home.
Original Mortgage
$525,000
Interest Rate
2.06%
Mortgage Type
Reverse Mortgage Home Equity Conversion Mortgage
Purchase Details
Closed on
Jun 9, 2005
Sold by
Schulz Roy O and Schulz Judith A
Bought by
Schulz Roy O and Schulz Judith A
Purchase Details
Closed on
Nov 14, 2001
Sold by
Schulz Roy O and Schulz Judith A
Bought by
Schulz Roy O and Schulz Judith A
Home Financials for this Owner
Home Financials are based on the most recent Mortgage that was taken out on this home.
Original Mortgage
$111,300
Interest Rate
6.57%
Purchase Details
Closed on
Mar 10, 1997
Sold by
Schulz Lina B and Schulz Roy O
Bought by
Schulz Roy O and Schulz Judith A
Create a Home Valuation Report for This Property
The Home Valuation Report is an in-depth analysis detailing your home's value as well as a comparison with similar homes in the area
Home Values in the Area
Average Home Value in this Area
Purchase History
| Date | Buyer | Sale Price | Title Company |
|---|---|---|---|
| Schulz Roy O | -- | Fnc Title Services Llc | |
| Schulz Roy O | $170,000 | -- | |
| Schulz Roy O | -- | Old Republic Title Company | |
| Schulz Roy O | -- | -- |
Source: Public Records
Mortgage History
| Date | Status | Borrower | Loan Amount |
|---|---|---|---|
| Closed | Schulz Roy O | $525,000 | |
| Closed | Schulz Roy O | $111,300 |
Source: Public Records
Tax History
| Year | Tax Paid | Tax Assessment Tax Assessment Total Assessment is a certain percentage of the fair market value that is determined by local assessors to be the total taxable value of land and additions on the property. | Land | Improvement |
|---|---|---|---|---|
| 2026 | $1,326 | $79,925 | $56,000 | $23,925 |
| 2025 | $1,287 | $77,274 | $52,500 | $24,774 |
| 2024 | $1,250 | $77,274 | $52,500 | $24,774 |
| 2023 | $1,250 | $64,485 | $39,900 | $24,585 |
| 2022 | $1,218 | $58,005 | $35,000 | $23,005 |
| 2021 | $1,184 | $53,506 | $31,150 | $22,356 |
| 2020 | $1,148 | $48,470 | $25,900 | $22,570 |
| 2019 | $1,115 | $48,513 | $25,900 | $22,613 |
| 2018 | $1,083 | $47,056 | $24,850 | $22,206 |
| 2017 | $1,130 | $45,904 | $23,100 | $22,804 |
| 2016 | $1,023 | $44,505 | $21,000 | $23,505 |
| 2015 | $1,023 | $41,056 | $17,500 | $23,556 |
| 2014 | $993 | $39,653 | $15,750 | $23,903 |
Source: Public Records
Map
Nearby Homes