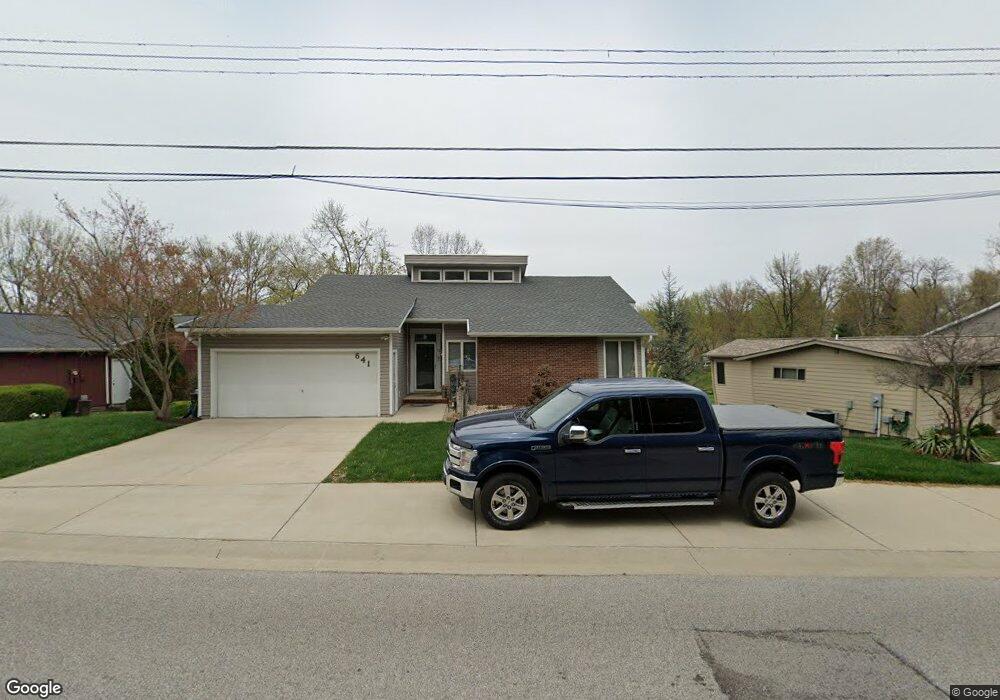
641 E Lake Dr Edwardsville, IL 62025
Estimated Value: $396,000 - $602,000
4
Beds
4
Baths
1,578
Sq Ft
$305/Sq Ft
Est. Value
About This Home
This home is located at 641 E Lake Dr, Edwardsville, IL 62025 and is currently estimated at $482,043, approximately $305 per square foot. 641 E Lake Dr is a home located in Madison County with nearby schools including LeClaire Elementary School, Columbus Elementary School, and Liberty Middle School.
Ownership History
Date
Name
Owned For
Owner Type
Purchase Details
Closed on
Aug 9, 2024
Sold by
Cundiff Daniel J and Cundiff Lisa R
Bought by
Bunselmeyer Christopher L and Bunselmeyer Janice L
Current Estimated Value
Home Financials for this Owner
Home Financials are based on the most recent Mortgage that was taken out on this home.
Original Mortgage
$468,000
Outstanding Balance
$463,201
Interest Rate
7.38%
Mortgage Type
New Conventional
Estimated Equity
$18,842
Purchase Details
Closed on
Aug 1, 2003
Sold by
Alldredge Jack R and Alldredge Darlyne
Bought by
Cundiff Daniel J and Cundiff Lisa R
Home Financials for this Owner
Home Financials are based on the most recent Mortgage that was taken out on this home.
Original Mortgage
$148,000
Interest Rate
5.31%
Mortgage Type
Purchase Money Mortgage
Create a Home Valuation Report for This Property
The Home Valuation Report is an in-depth analysis detailing your home's value as well as a comparison with similar homes in the area
Home Values in the Area
Average Home Value in this Area
Purchase History
| Date | Buyer | Sale Price | Title Company |
|---|---|---|---|
| Bunselmeyer Christopher L | $520,000 | Abstracts & Titles | |
| Cundiff Daniel J | $185,000 | Chicago Title |
Source: Public Records
Mortgage History
| Date | Status | Borrower | Loan Amount |
|---|---|---|---|
| Open | Bunselmeyer Christopher L | $468,000 | |
| Previous Owner | Cundiff Daniel J | $148,000 |
Source: Public Records
Tax History Compared to Growth
Tax History
| Year | Tax Paid | Tax Assessment Tax Assessment Total Assessment is a certain percentage of the fair market value that is determined by local assessors to be the total taxable value of land and additions on the property. | Land | Improvement |
|---|---|---|---|---|
| 2024 | $7,199 | $102,980 | $17,530 | $85,450 |
| 2023 | $7,199 | $94,050 | $16,010 | $78,040 |
| 2022 | $6,623 | $85,280 | $14,520 | $70,760 |
| 2021 | $5,794 | $80,620 | $13,730 | $66,890 |
| 2020 | $5,585 | $77,840 | $13,260 | $64,580 |
| 2019 | $5,556 | $76,660 | $13,060 | $63,600 |
| 2018 | $5,426 | $72,130 | $12,290 | $59,840 |
| 2017 | $5,228 | $69,660 | $11,870 | $57,790 |
| 2016 | $4,681 | $69,660 | $11,870 | $57,790 |
| 2015 | $4,667 | $67,410 | $11,490 | $55,920 |
| 2014 | $4,667 | $67,410 | $11,490 | $55,920 |
| 2013 | $4,667 | $67,410 | $11,490 | $55,920 |
Source: Public Records
Map
Nearby Homes
- 7301 Providence Dr
- 115 Branch Dr
- 3856 Plymouth Dr
- 3841 Ember Ct
- 0 Hearthstone Subdivision Unit 23020342
- 4028 Sequoia Dr
- Covington 2 Car Plan at Hearthstone Place
- Culpepper Plan at Hearthstone Place
- Alexandria Plan at Hearthstone Place
- Bristol Plan at Hearthstone Place
- Hannah Plan at Hearthstone Place
- Bristol Villa Plan at Hearthstone Place
- Brady Plan at Hearthstone Place
- Bella Plan at Hearthstone Place
- Winchester A Plan at Hearthstone Place
- Sunrise Plan at Hearthstone Place
- Winchester B Plan at Hearthstone Place
- Titan Plan at Hearthstone Place
- Covington Plan at Hearthstone Place
- Scarlett Plan at Hearthstone Place