Estimated Value: $141,000 - $298,000
1
Bed
1
Bath
720
Sq Ft
$315/Sq Ft
Est. Value
About This Home
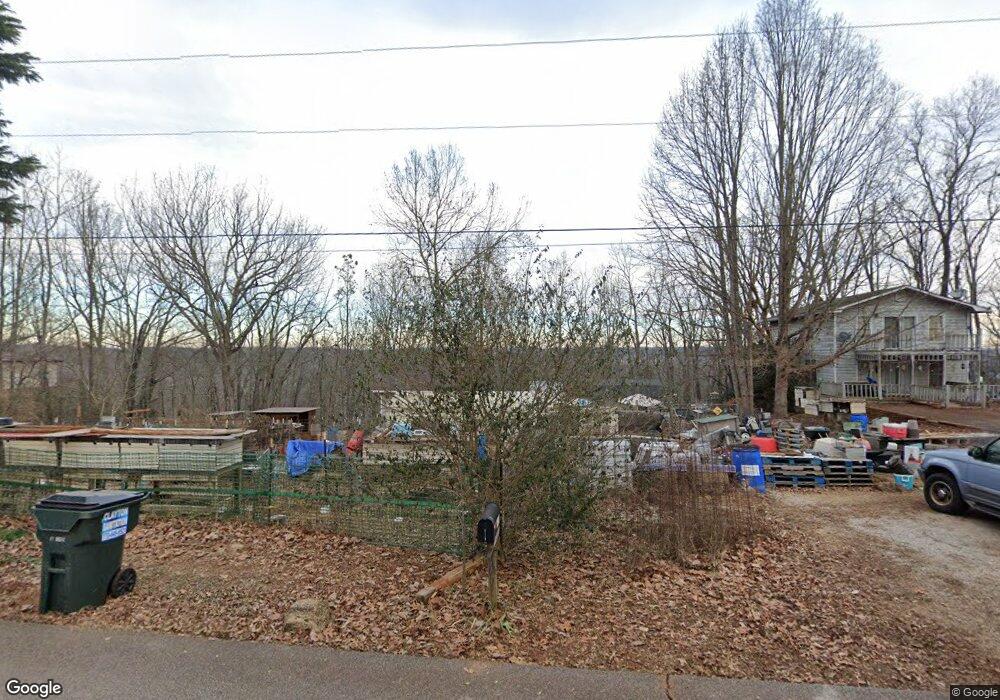
This home is located at 641 Garnet Ridge Rd, Hiram, GA 30141 and is currently estimated at $227,101, approximately $315 per square foot. 641 Garnet Ridge Rd is a home located in Paulding County with nearby schools including Hiram Elementary School, P. B. Ritch Middle School, and Hiram High School.
Ownership History
Date
Name
Owned For
Owner Type
Purchase Details
Closed on
Jun 22, 2011
Sold by
Federal Home Loan Mortgage Corporation
Bought by
Collins Theresa H
Current Estimated Value
Purchase Details
Closed on
Feb 1, 2011
Sold by
Ocwen Ln Servicing Llc
Bought by
Federal Home Loan Mortgage Corporation
Purchase Details
Closed on
Sep 21, 2005
Sold by
Walters Thomas R and Walters Connie
Bought by
Haberer Jonathon R
Home Financials for this Owner
Home Financials are based on the most recent Mortgage that was taken out on this home.
Original Mortgage
$75,300
Interest Rate
5.86%
Mortgage Type
New Conventional
Purchase Details
Closed on
Dec 20, 1982
Sold by
Stephens Robert B
Create a Home Valuation Report for This Property
The Home Valuation Report is an in-depth analysis detailing your home's value as well as a comparison with similar homes in the area
Home Values in the Area
Average Home Value in this Area
Purchase History
| Date | Buyer | Sale Price | Title Company |
|---|---|---|---|
| Collins Theresa H | $25,000 | -- | |
| Federal Home Loan Mortgage Corporation | -- | -- | |
| Haberer Jonathon R | $75,300 | -- | |
| -- | -- | -- |
Source: Public Records
Mortgage History
| Date | Status | Borrower | Loan Amount |
|---|---|---|---|
| Previous Owner | Haberer Jonathon R | $75,300 |
Source: Public Records
Tax History Compared to Growth
Tax History
| Year | Tax Paid | Tax Assessment Tax Assessment Total Assessment is a certain percentage of the fair market value that is determined by local assessors to be the total taxable value of land and additions on the property. | Land | Improvement |
|---|---|---|---|---|
| 2024 | $1,517 | $64,240 | $18,720 | $45,520 |
| 2023 | $1,553 | $62,080 | $18,080 | $44,000 |
| 2022 | $1,347 | $53,560 | $16,520 | $37,040 |
| 2021 | $1,157 | $41,680 | $13,440 | $28,240 |
| 2020 | $1,112 | $39,280 | $14,000 | $25,280 |
| 2019 | $1,057 | $36,920 | $14,360 | $22,560 |
| 2018 | $860 | $30,400 | $15,400 | $15,000 |
| 2017 | $831 | $29,080 | $14,760 | $14,320 |
| 2016 | $754 | $26,800 | $14,760 | $12,040 |
| 2015 | $734 | $25,720 | $14,480 | $11,240 |
| 2014 | $680 | $23,400 | $13,280 | $10,120 |
| 2013 | -- | $23,040 | $14,600 | $8,440 |
Source: Public Records
Map
Nearby Homes
- 647 Garnet Ridge Rd
- 609 Garnet Ridge Rd
- 547 Garnet Ridge Rd
- 634 Garnet Ridge Rd
- 689 Garnet Ridge Rd
- 572 Garnet Ridge Rd
- 720 Garnet Ridge Rd
- 519 Garnet Ridge Rd
- 540 Garnet Ridge Rd
- 656 Garnet Ridge Rd
- 726 Garnet Ridge Rd
- 773 Garnet Ridge Rd
- 502 Garnet Ridge Rd
- 792 Garnet Ridge Rd
- 476 Garnet Ridge Rd
- 679 Phillips Lee Rd
- 474 Garnet Ridge Rd
- 349 Garnet Ridge Rd
- 390 Garnet Ridge Rd
- 708 Phillips Lee Rd