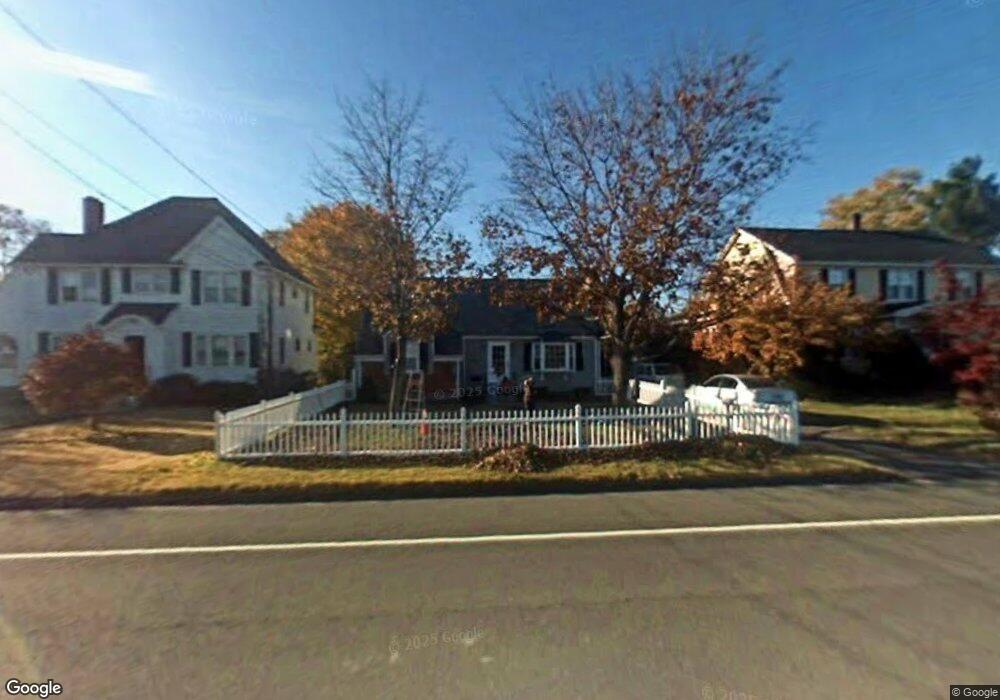
641 Main St Cromwell, CT 06416
Estimated Value: $375,704 - $411,000
3
Beds
2
Baths
1,457
Sq Ft
$273/Sq Ft
Est. Value
About This Home
This home is located at 641 Main St, Cromwell, CT 06416 and is currently estimated at $398,176, approximately $273 per square foot. 641 Main St is a home located in Middlesex County with nearby schools including Edna C. Stevens School, Woodside Intermediate School, and Cromwell Middle School.
Ownership History
Date
Name
Owned For
Owner Type
Purchase Details
Closed on
Aug 27, 1996
Sold by
Woodcock Timothy L and Woodcock Deborah L
Bought by
Acampora Jody A and Acampora Brenda D
Current Estimated Value
Purchase Details
Closed on
Feb 3, 1992
Sold by
Witte Nancy
Bought by
Woodcock Timothy L and Woodcock Deborah L
Create a Home Valuation Report for This Property
The Home Valuation Report is an in-depth analysis detailing your home's value as well as a comparison with similar homes in the area
Home Values in the Area
Average Home Value in this Area
Purchase History
| Date | Buyer | Sale Price | Title Company |
|---|---|---|---|
| Acampora Jody A | $109,000 | -- | |
| Woodcock Timothy L | $112,700 | -- |
Source: Public Records
Mortgage History
| Date | Status | Borrower | Loan Amount |
|---|---|---|---|
| Open | Woodcock Timothy L | $51,309 | |
| Closed | Woodcock Timothy L | $34,526 | |
| Open | Woodcock Timothy L | $165,200 |
Source: Public Records
Tax History
| Year | Tax Paid | Tax Assessment Tax Assessment Total Assessment is a certain percentage of the fair market value that is determined by local assessors to be the total taxable value of land and additions on the property. | Land | Improvement |
|---|---|---|---|---|
| 2025 | $5,158 | $167,510 | $59,850 | $107,660 |
| 2024 | $5,037 | $167,510 | $59,850 | $107,660 |
| 2023 | $4,926 | $167,510 | $59,850 | $107,660 |
| 2022 | $4,417 | $132,510 | $57,330 | $75,180 |
| 2021 | $4,417 | $132,510 | $57,330 | $75,180 |
| 2020 | $4,350 | $132,510 | $57,330 | $75,180 |
| 2019 | $4,350 | $132,510 | $57,330 | $75,180 |
| 2018 | $4,350 | $132,510 | $57,330 | $75,180 |
| 2017 | $4,382 | $129,160 | $49,390 | $79,770 |
| 2016 | $4,344 | $129,160 | $49,390 | $79,770 |
| 2015 | $4,053 | $129,160 | $49,390 | $79,770 |
| 2014 | $4,298 | $129,160 | $49,390 | $79,770 |
Source: Public Records
Map
Nearby Homes
Your Personal Tour Guide
Ask me questions while you tour the home.