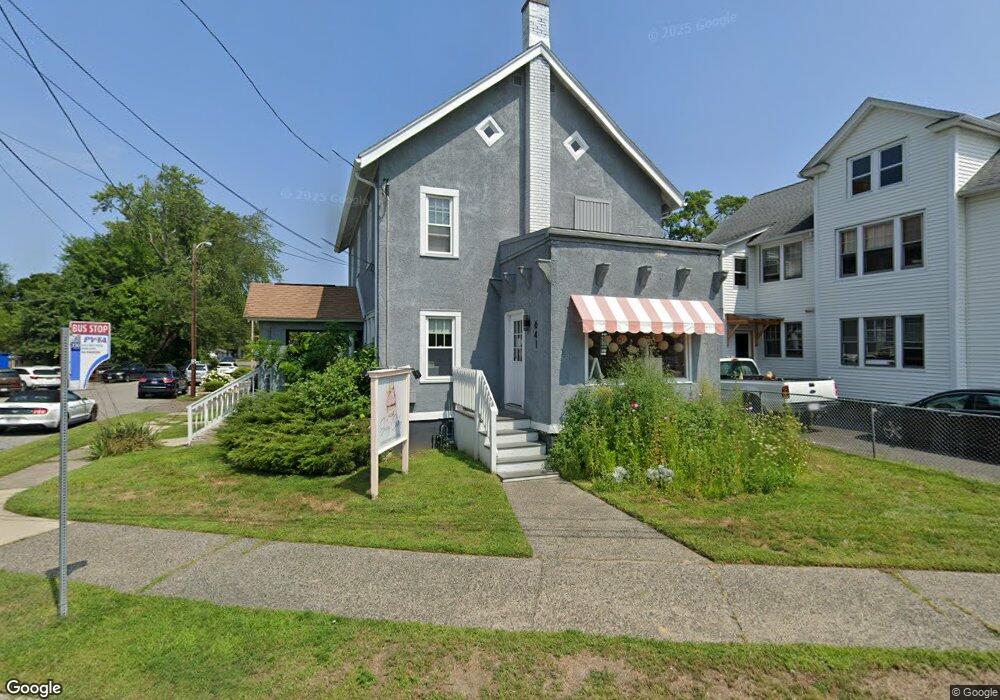
641 N Main St East Longmeadow, MA 01028
Estimated Value: $214,486
4
Beds
1
Bath
1,717
Sq Ft
$125/Sq Ft
Est. Value
About This Home
This home is located at 641 N Main St, East Longmeadow, MA 01028 and is currently estimated at $214,486, approximately $124 per square foot. 641 N Main St is a home located in Hampden County with nearby schools including Meadowbrook Elementary School, Birchland Park Middle School, and East Longmeadow High School.
Ownership History
Date
Name
Owned For
Owner Type
Purchase Details
Closed on
Sep 29, 2022
Sold by
Burke Properties Inc
Bought by
25 Granby Street Llc
Current Estimated Value
Home Financials for this Owner
Home Financials are based on the most recent Mortgage that was taken out on this home.
Original Mortgage
$144,000
Outstanding Balance
$137,638
Interest Rate
5.13%
Mortgage Type
Commercial
Estimated Equity
$76,848
Purchase Details
Closed on
Mar 22, 2005
Sold by
Ochoa Margaret Burke
Bought by
Burke Properties Inc
Purchase Details
Closed on
Dec 17, 1997
Sold by
Cava Patricia A
Bought by
Ochoa William C and Ochoa Margaret B
Home Financials for this Owner
Home Financials are based on the most recent Mortgage that was taken out on this home.
Original Mortgage
$98,000
Interest Rate
7.14%
Mortgage Type
Commercial
Create a Home Valuation Report for This Property
The Home Valuation Report is an in-depth analysis detailing your home's value as well as a comparison with similar homes in the area
Home Values in the Area
Average Home Value in this Area
Purchase History
| Date | Buyer | Sale Price | Title Company |
|---|---|---|---|
| 25 Granby Street Llc | $180,000 | None Available | |
| 25 Granby Street Llc | $180,000 | None Available | |
| Burke Properties Inc | -- | -- | |
| Burke Properties Inc | -- | -- | |
| Ochoa William C | $138,000 | -- | |
| Ochoa William C | $138,000 | -- |
Source: Public Records
Mortgage History
| Date | Status | Borrower | Loan Amount |
|---|---|---|---|
| Open | 25 Granby Street Llc | $144,000 | |
| Closed | 25 Granby Street Llc | $144,000 | |
| Previous Owner | Ochoa William C | $98,000 |
Source: Public Records
Tax History Compared to Growth
Tax History
| Year | Tax Paid | Tax Assessment Tax Assessment Total Assessment is a certain percentage of the fair market value that is determined by local assessors to be the total taxable value of land and additions on the property. | Land | Improvement |
|---|---|---|---|---|
| 2025 | $4,816 | $260,600 | $121,000 | $139,600 |
| 2024 | $4,629 | $249,700 | $121,000 | $128,700 |
| 2023 | $4,355 | $226,800 | $109,900 | $116,900 |
| 2022 | $4,299 | $211,900 | $104,600 | $107,300 |
| 2021 | $4,484 | $212,900 | $104,600 | $108,300 |
| 2020 | $4,324 | $207,500 | $104,600 | $102,900 |
| 2019 | $4,145 | $201,700 | $101,600 | $100,100 |
| 2018 | $3,561 | $201,700 | $101,600 | $100,100 |
| 2017 | $3,521 | $169,500 | $77,600 | $91,900 |
| 2016 | $3,430 | $162,400 | $70,500 | $91,900 |
| 2015 | $3,365 | $162,400 | $70,500 | $91,900 |
Source: Public Records
Map
Nearby Homes
- 32 Dorset St
- 26 Dwight Rd
- 38 Manchester Terrace
- 7 Turner St
- 157 Dwight Rd
- 22 Hartwick St
- 52 Luden St
- 26-28 Moulton St
- 33 Taber St
- 75 Bennington St
- 147 Belvidere St
- 914-916 Belmont Ave
- 58 Gilman St
- 910-912 Belmont Ave
- 116 Hartwick St
- 45 Fenimore Blvd
- 86 Belvidere St
- 615 White St
- 60 Blake St
- 114 Sylvan St Unit 116