Estimated Value: $288,000 - $360,000
3
Beds
2
Baths
1,563
Sq Ft
$202/Sq Ft
Est. Value
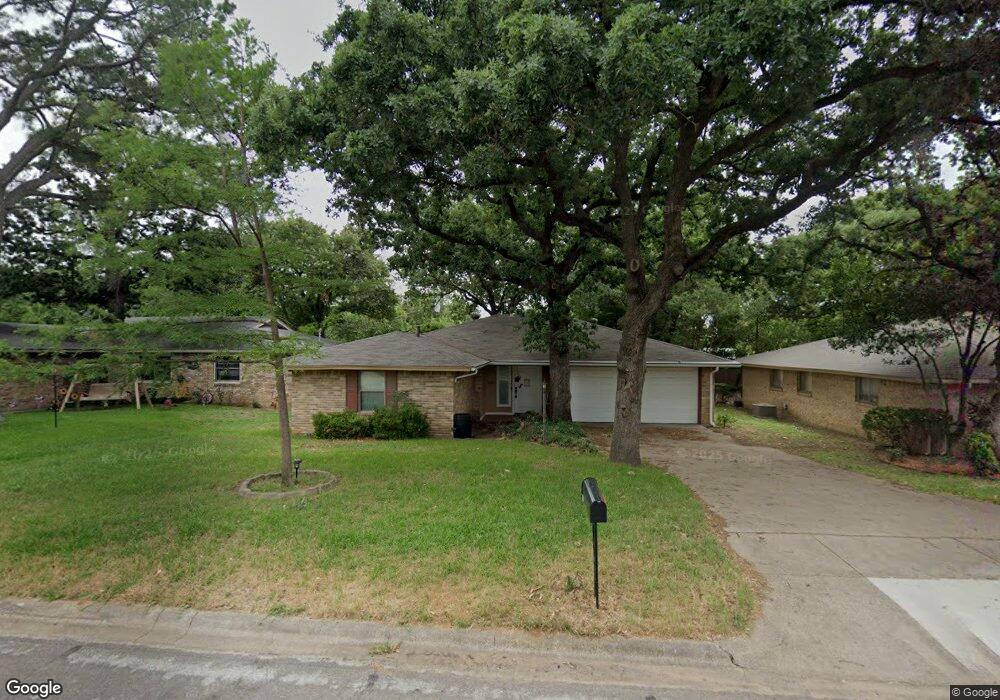
About This Home
This home is located at 641 Oak Dr, Hurst, TX 76053 and is currently estimated at $315,777, approximately $202 per square foot. 641 Oak Dr is a home located in Tarrant County with nearby schools including West Hurst Elementary School, Hurst J High School, and L.D. Bell High School.
Ownership History
Date
Name
Owned For
Owner Type
Purchase Details
Closed on
Dec 18, 2013
Sold by
Wimberley Robert G
Bought by
Vann Jeffereyp
Current Estimated Value
Home Financials for this Owner
Home Financials are based on the most recent Mortgage that was taken out on this home.
Original Mortgage
$121,600
Outstanding Balance
$90,888
Interest Rate
4.21%
Mortgage Type
Purchase Money Mortgage
Estimated Equity
$224,889
Purchase Details
Closed on
Dec 2, 2013
Sold by
Wimberley Shirley A
Bought by
Wimberley Robert G
Home Financials for this Owner
Home Financials are based on the most recent Mortgage that was taken out on this home.
Original Mortgage
$121,600
Outstanding Balance
$90,888
Interest Rate
4.21%
Mortgage Type
Purchase Money Mortgage
Estimated Equity
$224,889
Purchase Details
Closed on
Jan 15, 1999
Sold by
Guthrie Viavonne L
Bought by
Wimberley Robert G and Wimberley Shirley
Create a Home Valuation Report for This Property
The Home Valuation Report is an in-depth analysis detailing your home's value as well as a comparison with similar homes in the area
Home Values in the Area
Average Home Value in this Area
Purchase History
We collect this data history from publicly available records. To have your information removed, we recommend requesting removal directly through your county’s website.
| Date | Buyer | Sale Price | Title Company |
|---|---|---|---|
| Vann Jeffereyp | -- | None Available | |
| Wimberley Robert G | -- | None Available | |
| Wimberley Robert G | -- | -- |
Source: Public Records
Mortgage History
We collect this data history from publicly available records. To have your information removed, we recommend requesting removal directly through your county’s website.
| Date | Status | Borrower | Loan Amount |
|---|---|---|---|
| Open | Vann Jeffereyp | $121,600 |
Source: Public Records
Tax History
| Year | Tax Paid | Tax Assessment Tax Assessment Total Assessment is a certain percentage of the fair market value that is determined by local assessors to be the total taxable value of land and additions on the property. | Land | Improvement |
|---|---|---|---|---|
| 2025 | $2,916 | $230,889 | -- | -- |
| 2024 | $2,861 | $269,047 | $60,000 | $209,047 |
| 2023 | $3,823 | $268,433 | $30,000 | $238,433 |
| 2022 | $3,994 | $226,533 | $30,000 | $196,533 |
| 2021 | $3,803 | $157,700 | $30,000 | $127,700 |
| 2020 | $3,615 | $157,700 | $30,000 | $127,700 |
| 2019 | $3,343 | $170,629 | $30,000 | $140,629 |
| 2018 | $2,513 | $124,182 | $18,000 | $106,182 |
| 2017 | $2,857 | $148,390 | $18,000 | $130,390 |
| 2016 | $3,317 | $131,066 | $18,000 | $113,066 |
| 2015 | $2,447 | $93,300 | $15,000 | $78,300 |
| 2014 | $2,447 | $93,300 | $15,000 | $78,300 |
Source: Public Records
Map
Nearby Homes
Your Personal Tour Guide
Ask me questions while you tour the home.