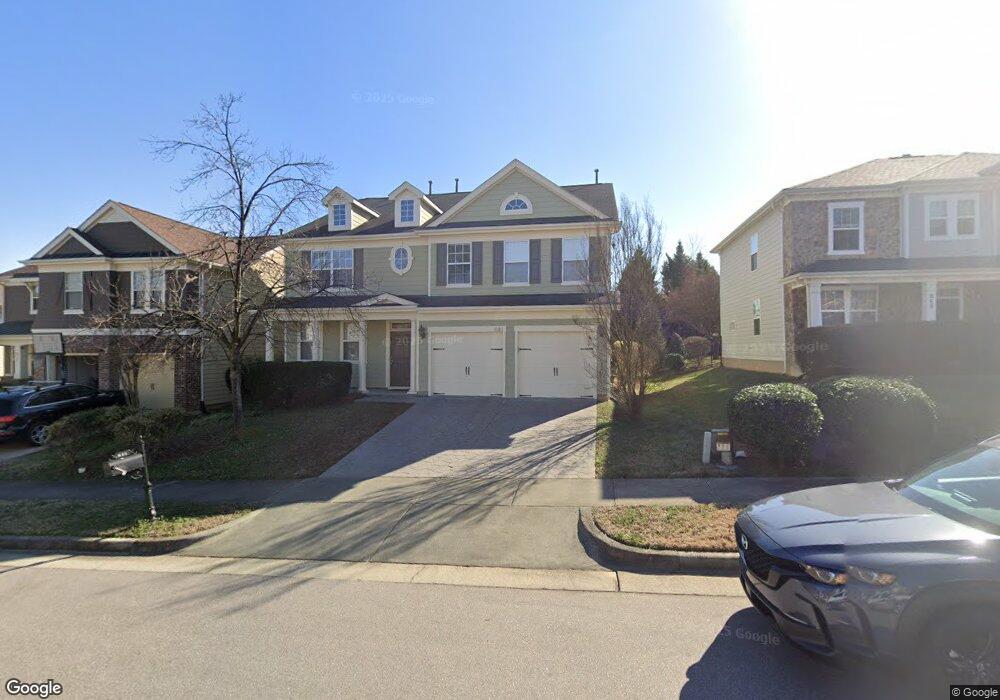
641 Piper Stream Cir Cary, NC 27519
Twin Lakes NeighborhoodEstimated Value: $723,000 - $780,000
4
Beds
3
Baths
3,550
Sq Ft
$210/Sq Ft
Est. Value
About This Home
This home is located at 641 Piper Stream Cir, Cary, NC 27519 and is currently estimated at $745,715, approximately $210 per square foot. 641 Piper Stream Cir is a home located in Wake County with nearby schools including Cedar Fork Elementary, West Cary Middle School, and Panther Creek High School.
Ownership History
Date
Name
Owned For
Owner Type
Purchase Details
Closed on
Mar 18, 2019
Sold by
Channappa Sunil and Parswanath Smitha R
Bought by
Pradhan Abhyuday H and Pradhan Shweta
Current Estimated Value
Home Financials for this Owner
Home Financials are based on the most recent Mortgage that was taken out on this home.
Original Mortgage
$394,250
Outstanding Balance
$346,613
Interest Rate
4.4%
Mortgage Type
New Conventional
Estimated Equity
$399,102
Purchase Details
Closed on
Oct 25, 2007
Sold by
Kb Home Raleigh Durham Inc
Bought by
Channappa Sunil and Parswanath Smitha R
Home Financials for this Owner
Home Financials are based on the most recent Mortgage that was taken out on this home.
Original Mortgage
$287,111
Interest Rate
5%
Mortgage Type
Purchase Money Mortgage
Purchase Details
Closed on
Jun 22, 2007
Sold by
Sandler At Twin Lakes Llc
Bought by
Kb Home Raleigh Durham Inc
Create a Home Valuation Report for This Property
The Home Valuation Report is an in-depth analysis detailing your home's value as well as a comparison with similar homes in the area
Home Values in the Area
Average Home Value in this Area
Purchase History
| Date | Buyer | Sale Price | Title Company |
|---|---|---|---|
| Pradhan Abhyuday H | $415,000 | None Available | |
| Channappa Sunil | $359,000 | None Available | |
| Kb Home Raleigh Durham Inc | $2,823,500 | None Available |
Source: Public Records
Mortgage History
| Date | Status | Borrower | Loan Amount |
|---|---|---|---|
| Open | Pradhan Abhyuday H | $394,250 | |
| Previous Owner | Channappa Sunil | $287,111 |
Source: Public Records
Tax History
| Year | Tax Paid | Tax Assessment Tax Assessment Total Assessment is a certain percentage of the fair market value that is determined by local assessors to be the total taxable value of land and additions on the property. | Land | Improvement |
|---|---|---|---|---|
| 2025 | $6,006 | $698,396 | $180,000 | $518,396 |
| 2024 | $5,876 | $698,396 | $180,000 | $518,396 |
| 2023 | $4,682 | $465,317 | $90,000 | $375,317 |
| 2022 | $4,508 | $465,317 | $90,000 | $375,317 |
| 2021 | $4,417 | $465,317 | $90,000 | $375,317 |
| 2020 | $4,441 | $465,317 | $90,000 | $375,317 |
| 2019 | $4,135 | $384,295 | $78,000 | $306,295 |
| 2018 | $3,880 | $384,295 | $78,000 | $306,295 |
| 2017 | $3,728 | $384,295 | $78,000 | $306,295 |
| 2016 | $3,673 | $384,295 | $78,000 | $306,295 |
| 2015 | $3,643 | $368,040 | $60,000 | $308,040 |
| 2014 | $3,435 | $368,040 | $60,000 | $308,040 |
Source: Public Records
Map
Nearby Homes
- 548 Abbey Fields Loop
- 3147 Rapid Falls Rd
- 316 Valley Glen Dr
- 605 Beech Hanger Dr
- 106 Honeycomb Ln
- 170 Point Comfort Ln
- 417 Downing Glen Dr
- 1329 Alemany St
- 226 Leacroft Way
- 105 Bayless Ridge Ct
- 309 Malvern Hill Ln
- 541 Berry Chase Way
- 313 Indian Branch Dr
- 1219 Foxglove Dr
- 113 Concordia Woods Dr
- 600 Courthouse Dr
- 1212 Checkerberry Dr Unit 34
- 1116 Checkerberry Dr
- 1017 Craigmeade Dr
- 11201 Jeremiah St
- 637 Piper Stream Cir
- 645 Piper Stream Cir
- 307 Lime Creek Ct
- 635 Piper Stream Cir
- 305 Lime Creek Ct
- 308 Lime Creek Ct
- 640 Piper Stream Cir
- 510 Front Ridge Dr
- 642 Piper Stream Cir
- 512 Front Ridge Dr
- 638 Piper Stream Cir
- 631 Piper Stream Cir
- 514 Front Ridge Dr
- 303 Lime Creek Ct
- 644 Piper Stream Cir
- 636 Piper Stream Cir
- 306 Lime Creek Ct
- 634 Piper Stream Cir
- 623 Piper Stream Cir
- 646 Piper Stream Cir
Your Personal Tour Guide
Ask me questions while you tour the home.