Estimated Value: $227,000 - $293,000
3
Beds
2
Baths
1,568
Sq Ft
$168/Sq Ft
Est. Value
About This Home
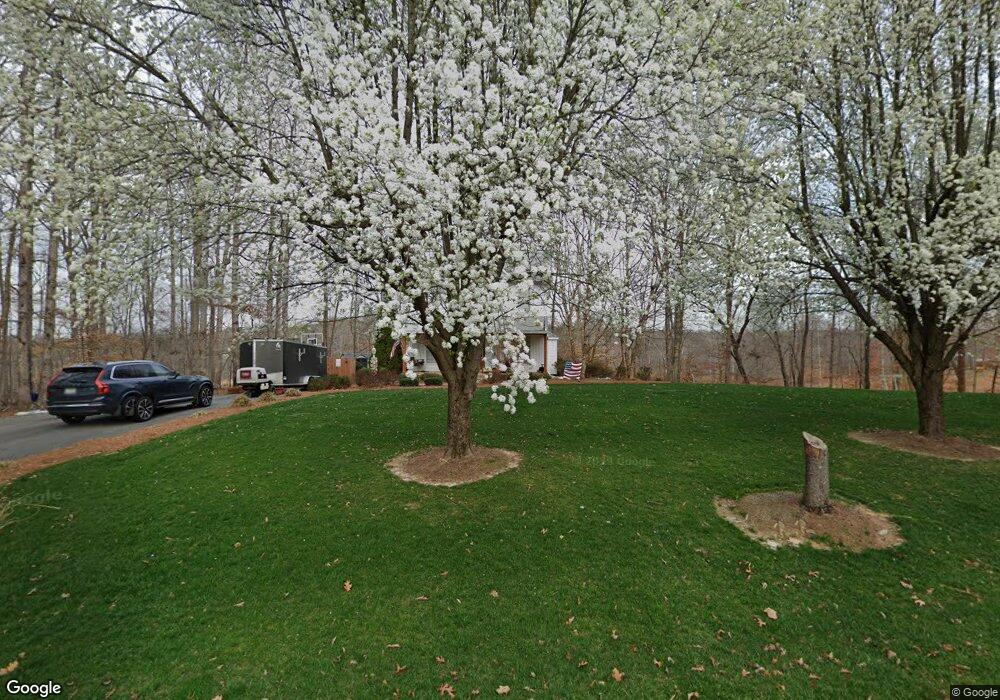
This home is located at 641 Rob Tom Rd, Eden, NC 27288 and is currently estimated at $262,732, approximately $167 per square foot. 641 Rob Tom Rd is a home located in Rockingham County with nearby schools including Wentworth Elementary School, Rockingham County Middle School, and Rockingham County High School.
Ownership History
Date
Name
Owned For
Owner Type
Purchase Details
Closed on
Dec 9, 2011
Sold by
Secretary Of Housing & Urban Development
Bought by
Loye Dennis James
Current Estimated Value
Home Financials for this Owner
Home Financials are based on the most recent Mortgage that was taken out on this home.
Original Mortgage
$109,183
Outstanding Balance
$74,868
Interest Rate
4.06%
Mortgage Type
New Conventional
Estimated Equity
$187,864
Purchase Details
Closed on
Aug 4, 2011
Sold by
Wells Fargo Bank Na
Bought by
Secretary Of Housing & Urban Development
Purchase Details
Closed on
Jul 8, 2011
Sold by
Patterson Charles W and Patterson Sherri M
Bought by
Wells Fargo Bank N A
Purchase Details
Closed on
Dec 27, 2007
Sold by
Vernon Christopher S and Vernon Stephanie W
Bought by
Patterson Charles W and Patterson Sherri M
Home Financials for this Owner
Home Financials are based on the most recent Mortgage that was taken out on this home.
Original Mortgage
$142,100
Interest Rate
6.05%
Mortgage Type
FHA
Create a Home Valuation Report for This Property
The Home Valuation Report is an in-depth analysis detailing your home's value as well as a comparison with similar homes in the area
Home Values in the Area
Average Home Value in this Area
Purchase History
| Date | Buyer | Sale Price | Title Company |
|---|---|---|---|
| Loye Dennis James | -- | None Available | |
| Secretary Of Housing & Urban Development | -- | None Available | |
| Wells Fargo Bank N A | $151,891 | None Available | |
| Patterson Charles W | $150,000 | None Available |
Source: Public Records
Mortgage History
| Date | Status | Borrower | Loan Amount |
|---|---|---|---|
| Open | Loye Dennis James | $109,183 | |
| Previous Owner | Patterson Charles W | $142,100 |
Source: Public Records
Tax History
| Year | Tax Paid | Tax Assessment Tax Assessment Total Assessment is a certain percentage of the fair market value that is determined by local assessors to be the total taxable value of land and additions on the property. | Land | Improvement |
|---|---|---|---|---|
| 2025 | $1,616 | $244,878 | $34,633 | $210,245 |
| 2024 | $1,586 | $244,878 | $34,633 | $210,245 |
| 2023 | $1,586 | $137,338 | $15,908 | $121,430 |
| 2022 | $1,092 | $137,338 | $15,908 | $121,430 |
| 2021 | $1,092 | $137,338 | $15,908 | $121,430 |
| 2020 | $1,092 | $137,338 | $15,908 | $121,430 |
| 2019 | $1,092 | $137,338 | $15,908 | $121,430 |
| 2018 | $1,077 | $135,274 | $24,913 | $110,361 |
| 2017 | $1,077 | $135,274 | $24,913 | $110,361 |
| 2015 | $1,119 | $135,274 | $24,913 | $110,361 |
| 2014 | -- | $135,274 | $24,913 | $110,361 |
Source: Public Records
Map
Nearby Homes
- 914 Bethlehem Church Rd
- 191 Caudle Ln
- 0000 N Carolina 87
- 120 Sanderlyn Ct
- 590 Bethlehem Church Rd
- 129 Legacy Ln
- 112 Yount Rd
- 132 Legacy Ln
- 1325 Tellowee Rd
- 323 Anderson Rd
- 11948 Nc Highway 87 S
- 572 Anderson Rd
- 0 Bethlehem Church Rd
- 363 Periwinkle Rd
- 0 Silver Leaf Trail Unit 801164
- 200 W Harris Place
- 115 Mountain Laurel Trail
- 196 Jarrell Rd
- 231 River Ridge Rd
- 262 Glendale Cir
- 640 Rob Tom Rd
- 565 Rob Tom Rd
- 560 Rob Tom Rd
- 000 Rob Tom Rd
- 510 Rob Tom Rd
- Tract 2 Rob Tom Rd
- 293 Daisy Rd
- 451 Rob Tom Rd
- Tract 6 Rob Tom Rd
- 420 Rob Tom Rd
- 231 Daisy Rd
- 400 Rob Tom Rd
- Tract 1 Rob Tom Rd
- 912 Bethlehem Church Rd
- Tract E Rob Tom Rd
- Tract D Rob Tom Rd
- Tract C Rob Tom Rd
- Tract B Rob Tom Rd
- Tract A Rob Tom Rd Unit Tract A
- 800 Harrington Hwy
Your Personal Tour Guide
Ask me questions while you tour the home.