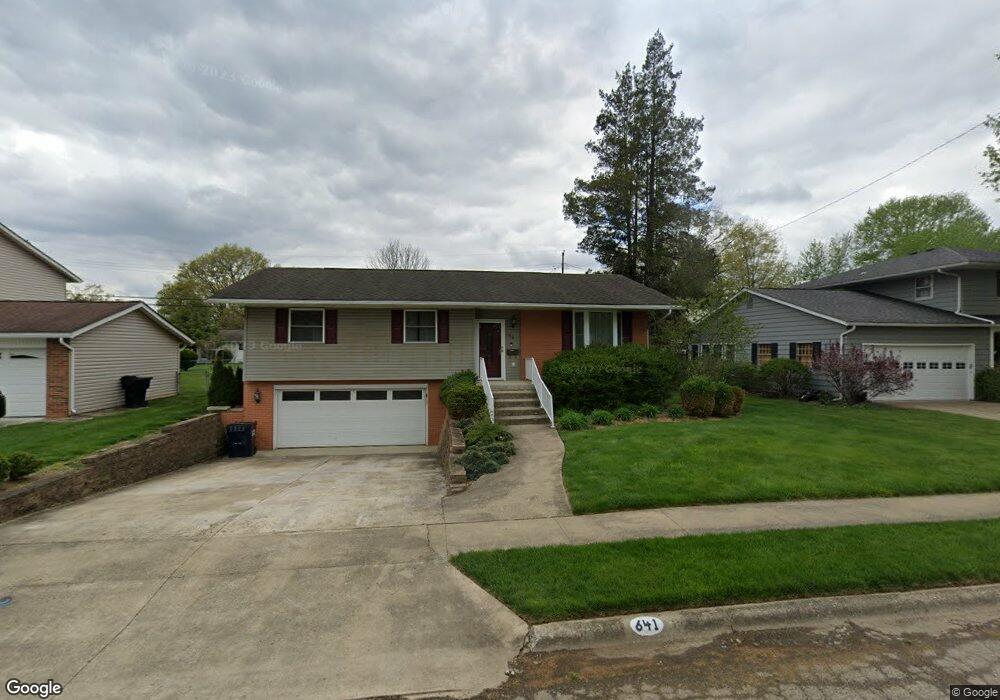
641 Robin Ln Newark, OH 43055
Estimated Value: $241,462 - $318,000
3
Beds
2
Baths
1,709
Sq Ft
$160/Sq Ft
Est. Value
About This Home
This home is located at 641 Robin Ln, Newark, OH 43055 and is currently estimated at $274,116, approximately $160 per square foot. 641 Robin Ln is a home located in Licking County with nearby schools including John Clem Elementary School, Liberty Middle School, and Newark High School.
Ownership History
Date
Name
Owned For
Owner Type
Purchase Details
Closed on
Jun 8, 2017
Sold by
Foster Ralph W and Foster Sandra
Bought by
Foster Lynn N
Current Estimated Value
Home Financials for this Owner
Home Financials are based on the most recent Mortgage that was taken out on this home.
Original Mortgage
$133,000
Outstanding Balance
$110,385
Interest Rate
3.94%
Mortgage Type
New Conventional
Estimated Equity
$163,731
Purchase Details
Closed on
May 25, 2005
Sold by
Foster Ralph W
Bought by
Foster Ralph W and Foster Sandra
Home Financials for this Owner
Home Financials are based on the most recent Mortgage that was taken out on this home.
Original Mortgage
$151,000
Interest Rate
10%
Mortgage Type
New Conventional
Purchase Details
Closed on
May 29, 1996
Sold by
Adams Karol S
Bought by
Foster Ralph W
Home Financials for this Owner
Home Financials are based on the most recent Mortgage that was taken out on this home.
Original Mortgage
$79,533
Interest Rate
7.99%
Mortgage Type
FHA
Create a Home Valuation Report for This Property
The Home Valuation Report is an in-depth analysis detailing your home's value as well as a comparison with similar homes in the area
Home Values in the Area
Average Home Value in this Area
Purchase History
| Date | Buyer | Sale Price | Title Company |
|---|---|---|---|
| Foster Lynn N | -- | None Available | |
| Foster Ralph W | -- | -- | |
| Foster Ralph W | $79,900 | -- |
Source: Public Records
Mortgage History
| Date | Status | Borrower | Loan Amount |
|---|---|---|---|
| Open | Foster Lynn N | $133,000 | |
| Closed | Foster Ralph W | $151,000 | |
| Closed | Foster Ralph W | $79,533 |
Source: Public Records
Tax History
| Year | Tax Paid | Tax Assessment Tax Assessment Total Assessment is a certain percentage of the fair market value that is determined by local assessors to be the total taxable value of land and additions on the property. | Land | Improvement |
|---|---|---|---|---|
| 2024 | $2,182 | $60,980 | $18,030 | $42,950 |
| 2023 | $2,178 | $60,980 | $18,030 | $42,950 |
| 2022 | $2,017 | $50,270 | $10,260 | $40,010 |
| 2021 | $2,116 | $50,270 | $10,260 | $40,010 |
| 2020 | $2,166 | $50,270 | $10,260 | $40,010 |
| 2019 | $1,782 | $39,870 | $7,880 | $31,990 |
| 2018 | $1,784 | $0 | $0 | $0 |
| 2017 | $1,759 | $0 | $0 | $0 |
| 2016 | $1,771 | $0 | $0 | $0 |
| 2015 | $1,810 | $0 | $0 | $0 |
| 2014 | $2,318 | $0 | $0 | $0 |
| 2013 | $1,886 | $0 | $0 | $0 |
Source: Public Records
Map
Nearby Homes
- 469 King Ct
- 584 Moull St Unit A
- 946 Lateglow Ct
- 189 N Quentin Rd
- 222 Bachmann Ave
- 476 W Shields St
- 188 Meadow Dr
- 184 Meadow Dr
- 632 Moull St
- 1008 Kingsbury Ct Unit 1008
- 792 Stone Ridge Way Unit 792
- 655 Evans St
- 158 English Ave
- 15 W Postal Ave
- 34 Charles St
- 385 Woods Ave
- 565 Granville St
- 49 E Channel St
- 355 Eddy St
- 574 Blakeley Place Unit 574
Your Personal Tour Guide
Ask me questions while you tour the home.