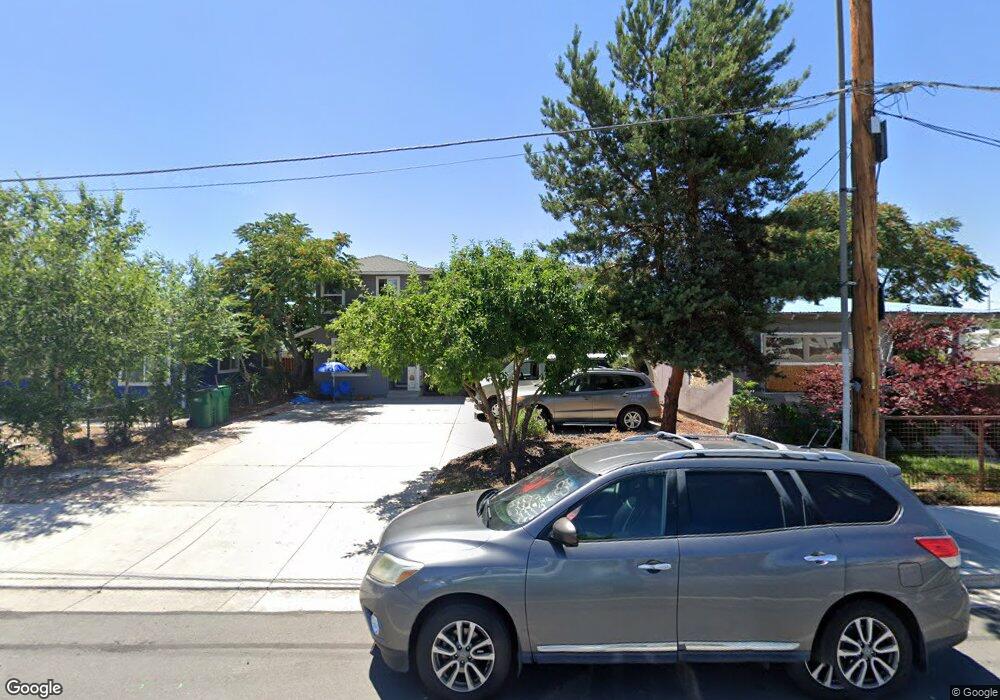
641 Sutro St Unit Sutro St. Unit A,B,C Reno, NV 89512
Downtown Reno NeighborhoodEstimated Value: $290,000 - $357,000
2
Beds
1
Bath
2,630
Sq Ft
$125/Sq Ft
Est. Value
About This Home
This home is located at 641 Sutro St Unit Sutro St. Unit A,B,C, Reno, NV 89512 and is currently estimated at $327,631, approximately $124 per square foot. 641 Sutro St Unit Sutro St. Unit A,B,C is a home located in Washoe County with nearby schools including Libby C Booth Elementary School, Vaughn Middle School, and Earl Wooster High School.
Ownership History
Date
Name
Owned For
Owner Type
Purchase Details
Closed on
Nov 6, 2017
Sold by
Yackley Ashley Lynn
Bought by
Schlling Kevin L
Current Estimated Value
Purchase Details
Closed on
Aug 16, 2010
Sold by
Schilling Beth J
Bought by
Schilling Kevin L
Home Financials for this Owner
Home Financials are based on the most recent Mortgage that was taken out on this home.
Original Mortgage
$78,000
Interest Rate
4.52%
Mortgage Type
Unknown
Purchase Details
Closed on
Aug 13, 2010
Sold by
The Bank Of New York Mellon Trust Compan
Bought by
Schilling Kevin L
Home Financials for this Owner
Home Financials are based on the most recent Mortgage that was taken out on this home.
Original Mortgage
$78,000
Interest Rate
4.52%
Mortgage Type
Unknown
Purchase Details
Closed on
Jan 5, 2010
Sold by
Pyles Philip B
Bought by
The Bank Of New York Mellon Trust Compan and The Bank Of New York Trust Company Na
Create a Home Valuation Report for This Property
The Home Valuation Report is an in-depth analysis detailing your home's value as well as a comparison with similar homes in the area
Home Values in the Area
Average Home Value in this Area
Purchase History
| Date | Buyer | Sale Price | Title Company |
|---|---|---|---|
| Schlling Kevin L | -- | None Available | |
| Schilling Kevin L | -- | Ticor Title Reno | |
| Schilling Kevin L | $130,000 | Ticor Title Reno | |
| The Bank Of New York Mellon Trust Compan | $142,370 | Accommodation |
Source: Public Records
Mortgage History
| Date | Status | Borrower | Loan Amount |
|---|---|---|---|
| Previous Owner | Schilling Kevin L | $78,000 |
Source: Public Records
Tax History Compared to Growth
Tax History
| Year | Tax Paid | Tax Assessment Tax Assessment Total Assessment is a certain percentage of the fair market value that is determined by local assessors to be the total taxable value of land and additions on the property. | Land | Improvement |
|---|---|---|---|---|
| 2025 | $798 | $46,890 | $16,538 | $30,353 |
| 2024 | $775 | $47,011 | $16,538 | $30,474 |
| 2023 | $775 | $43,163 | $14,394 | $28,770 |
| 2022 | $718 | $35,748 | $11,723 | $24,024 |
| 2021 | $659 | $34,414 | $10,535 | $23,879 |
| 2020 | $618 | $34,444 | $10,535 | $23,909 |
| 2019 | $589 | $33,206 | $10,168 | $23,038 |
| 2018 | $562 | $29,427 | $6,956 | $22,471 |
| 2017 | $539 | $26,938 | $4,428 | $22,510 |
| 2016 | $583 | $27,445 | $4,428 | $23,017 |
| 2015 | $145 | $26,247 | $3,325 | $22,922 |
| 2014 | $565 | $25,002 | $3,150 | $21,852 |
| 2013 | -- | $13,475 | $2,695 | $10,780 |
Source: Public Records
Map
Nearby Homes
- 1424 E 9th St Unit 2
- 1412 E 9th St Unit 7
- 1414 E 9th St Unit 4
- 1281 E 10th St
- 656 Eureka Ave
- 920 Montello St
- 1365 E 11th St
- 802 E 4th St
- 650 Elko Ave
- 350 N Park St
- 1525 Carville Dr
- 462 Laurel St
- 442 E 7th St Unit 1 & 2
- 440 E 7th St
- 1775 Carville Dr
- 496 Highland Ave
- 785 Aitken St
- 344 E 7th St
- 336 E 7th St
- 1680 Sutro St
- 641 Sutro St Unit B
- 641 Sutro St Unit A, B, C
- 641 Sutro St Unit A
- 641 Sutro St
- 641 Sutro St Unit C
- 641 Sutro St Unit NV
- 641 Sutro A B C
- 641 Sutro Abc
- 647 Sutro St
- 647 Sutro St
- 627 Sutro St
- 632 Quincy St
- 632 & 640 Quincy
- 628 Quincy St
- 654 Quincy St
- 624 Quincy St
- 614 Quincy St
- 662 Quincy St
- 695 Sutro St
- 668 Quincy St Unit A & B , 1116 E. 7TH