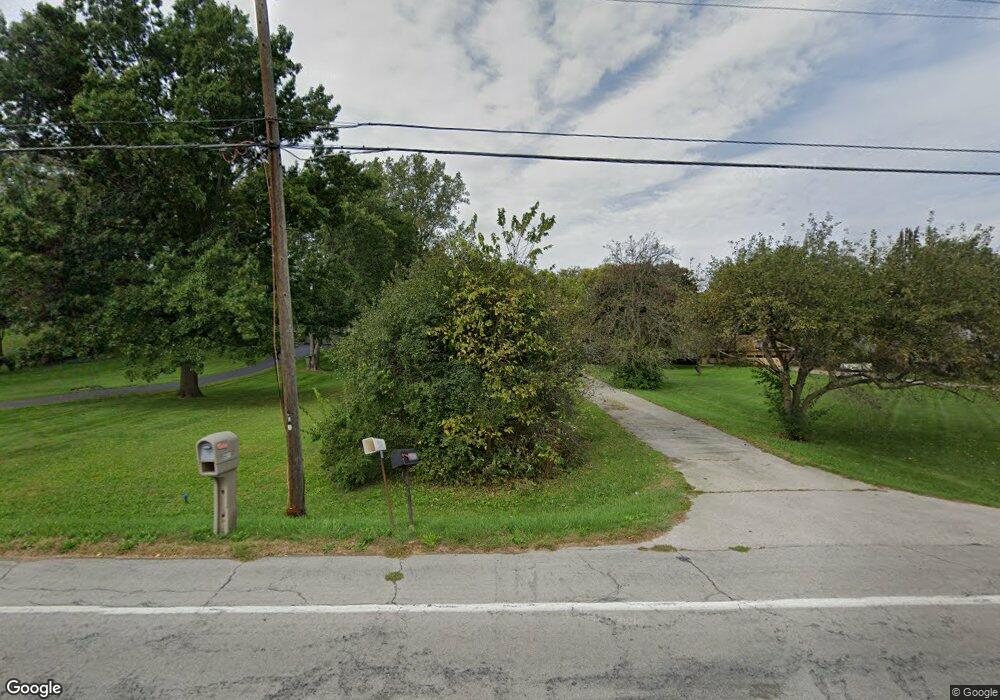
6410 N River Rd Waterville, OH 43566
West Lucas County NeighborhoodEstimated Value: $260,000 - $392,000
4
Beds
2
Baths
1,392
Sq Ft
$237/Sq Ft
Est. Value
About This Home
This home is located at 6410 N River Rd, Waterville, OH 43566 and is currently estimated at $330,097, approximately $237 per square foot. 6410 N River Rd is a home located in Lucas County with nearby schools including Anthony Wayne High School, St Joseph Catholic School, and Monclova Christian Academy.
Ownership History
Date
Name
Owned For
Owner Type
Purchase Details
Closed on
Sep 30, 2022
Sold by
Rar Investments Ltd
Bought by
Henry John A and Henry Amanda
Current Estimated Value
Home Financials for this Owner
Home Financials are based on the most recent Mortgage that was taken out on this home.
Original Mortgage
$261,375
Outstanding Balance
$249,242
Interest Rate
4.84%
Mortgage Type
New Conventional
Estimated Equity
$80,855
Purchase Details
Closed on
Sep 23, 2019
Sold by
Beckler Susan A and Green Merritt W
Bought by
Rar Investments Ltd
Home Financials for this Owner
Home Financials are based on the most recent Mortgage that was taken out on this home.
Original Mortgage
$98,000
Interest Rate
3.6%
Mortgage Type
Commercial
Purchase Details
Closed on
Oct 1, 2003
Sold by
Green Ann M
Bought by
Green Ann M and Beckler Susan A
Create a Home Valuation Report for This Property
The Home Valuation Report is an in-depth analysis detailing your home's value as well as a comparison with similar homes in the area
Home Values in the Area
Average Home Value in this Area
Purchase History
| Date | Buyer | Sale Price | Title Company |
|---|---|---|---|
| Henry John A | $307,500 | None Listed On Document | |
| Rar Investments Ltd | $122,500 | None Available | |
| Green Ann M | -- | -- | |
| Green Ann M | -- | -- |
Source: Public Records
Mortgage History
| Date | Status | Borrower | Loan Amount |
|---|---|---|---|
| Open | Henry John A | $261,375 | |
| Previous Owner | Rar Investments Ltd | $98,000 |
Source: Public Records
Tax History Compared to Growth
Tax History
| Year | Tax Paid | Tax Assessment Tax Assessment Total Assessment is a certain percentage of the fair market value that is determined by local assessors to be the total taxable value of land and additions on the property. | Land | Improvement |
|---|---|---|---|---|
| 2024 | $2,276 | $82,425 | $22,820 | $59,605 |
| 2023 | $3,468 | $55,300 | $13,545 | $41,755 |
| 2022 | $3,560 | $55,300 | $13,545 | $41,755 |
| 2021 | $3,582 | $55,300 | $13,545 | $41,755 |
| 2020 | $3,297 | $45,255 | $10,990 | $34,265 |
| 2019 | $2,459 | $45,255 | $10,990 | $34,265 |
| 2018 | $2,384 | $45,255 | $10,990 | $34,265 |
| 2017 | $3,801 | $44,310 | $9,555 | $34,755 |
| 2016 | $2,478 | $126,600 | $27,300 | $99,300 |
| 2015 | $2,384 | $126,600 | $27,300 | $99,300 |
| 2014 | $2,334 | $43,860 | $9,450 | $34,410 |
| 2013 | $2,334 | $43,860 | $9,450 | $34,410 |
Source: Public Records
Map
Nearby Homes
- 6336 N River Rd
- 7538 Tournament Dr
- 25101 W River Rd
- 25182 W River Rd
- 25581 Normandy Rd W
- 15672 River View Place
- 5845 N River Rd
- 24633 W River Rd
- 5925 Waterville Monclova Rd
- 1355 Roberts Cir
- 15024 N Cape Ct
- 15100 Sugar Maple Dr
- 15114 Sugar Maple Dr
- 8346 Dutch Rd
- 26006 Seminary Rd
- 25231 John F McCarthy Way
- 25922 Seminary Rd
- 3640 Turtle Creek Dr
- 25240 John F McCarthy Way
- 25216 John F McCarthy Way
- 6418 N River Rd
- 6402 N River Rd
- 6428 N River Rd
- 6358 N River Rd
- 6436 N River Rd
- 6350 N River Rd
- 6448 N River Rd
- 6344 N River Rd
- 6391 N River Road Lot#7
- 6391 N River Road Lot #3
- 6331 Anthony Wayne Trail
- 6330 N River Rd
- 6510 N River Rd
- 6357 N River Rd
- 6411 N River Rd
- 7228 Dutch Rd
- 7205 Dutch Rd
- 6515 N River Rd
- 7213 Dutch Rd
- 7227 Dutch Rd