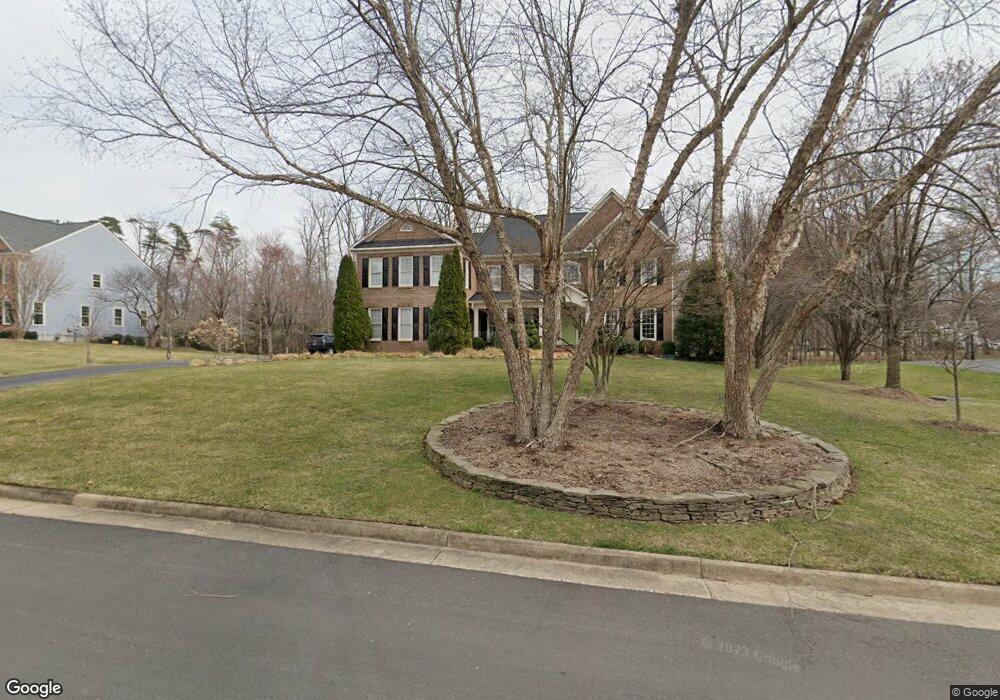
6411 Noble Rock Ct Clifton, VA 20124
Estimated Value: $1,136,220 - $1,533,000
5
Beds
5
Baths
3,940
Sq Ft
$334/Sq Ft
Est. Value
About This Home
This home is located at 6411 Noble Rock Ct, Clifton, VA 20124 and is currently estimated at $1,317,305, approximately $334 per square foot. 6411 Noble Rock Ct is a home located in Fairfax County with nearby schools including Union Mill Elementary School, Liberty Middle School, and Centreville High School.
Ownership History
Date
Name
Owned For
Owner Type
Purchase Details
Closed on
Aug 21, 2020
Sold by
Desai Parimal C and Desai Kala P
Bought by
Desai Parimal C and Desai Kala P
Current Estimated Value
Purchase Details
Closed on
Dec 7, 2010
Sold by
Desai Trustee Parimal C and Desai Trustee Kala P
Bought by
Desai Parimal C and Desai Kala P
Home Financials for this Owner
Home Financials are based on the most recent Mortgage that was taken out on this home.
Original Mortgage
$417,000
Interest Rate
4.89%
Mortgage Type
New Conventional
Purchase Details
Closed on
Dec 3, 1996
Sold by
Laurel Rock Lc
Bought by
Desai Parimal C and Desai Kala P
Home Financials for this Owner
Home Financials are based on the most recent Mortgage that was taken out on this home.
Original Mortgage
$331,500
Interest Rate
7.82%
Mortgage Type
New Conventional
Purchase Details
Closed on
Aug 6, 1996
Sold by
Hunter Development Co Of Fx Inc
Bought by
Laurel Rock Lc
Create a Home Valuation Report for This Property
The Home Valuation Report is an in-depth analysis detailing your home's value as well as a comparison with similar homes in the area
Home Values in the Area
Average Home Value in this Area
Purchase History
| Date | Buyer | Sale Price | Title Company |
|---|---|---|---|
| Desai Parimal C | -- | None Available | |
| Desai Parimal C | -- | -- | |
| Desai Parimal C | $452,110 | -- | |
| Laurel Rock Lc | $110,764 | -- |
Source: Public Records
Mortgage History
| Date | Status | Borrower | Loan Amount |
|---|---|---|---|
| Previous Owner | Desai Parimal C | $417,000 | |
| Previous Owner | Laurel Rock Lc | $331,500 |
Source: Public Records
Tax History Compared to Growth
Tax History
| Year | Tax Paid | Tax Assessment Tax Assessment Total Assessment is a certain percentage of the fair market value that is determined by local assessors to be the total taxable value of land and additions on the property. | Land | Improvement |
|---|---|---|---|---|
| 2025 | $11,456 | $1,064,770 | $315,000 | $749,770 |
| 2024 | $11,456 | $988,870 | $295,000 | $693,870 |
| 2023 | $11,234 | $995,440 | $295,000 | $700,440 |
| 2022 | $10,118 | $884,870 | $265,000 | $619,870 |
| 2021 | $9,174 | $781,770 | $235,000 | $546,770 |
| 2020 | $8,972 | $758,090 | $225,000 | $533,090 |
| 2019 | $8,814 | $744,760 | $225,000 | $519,760 |
| 2018 | $8,519 | $740,760 | $221,000 | $519,760 |
| 2017 | $8,435 | $726,570 | $217,000 | $509,570 |
| 2016 | $8,255 | $712,580 | $213,000 | $499,580 |
| 2015 | $8,203 | $735,030 | $220,000 | $515,030 |
| 2014 | $7,833 | $703,500 | $210,000 | $493,500 |
Source: Public Records
Map
Nearby Homes
- 6401 Noble Rock Ct
- 13813 Foggy Hills Ct
- 13910 Stonefield Ln
- 13209 Johnny Moore Ln
- 6204 Mountain Spring Ct
- 6218 Stonehunt Place
- 13633 Union Village Cir
- 13406 Compton Rd
- 14159 Autumn Cir
- 14102 Autumn Cir
- 14216 Hartwood Ct
- 6316 Mary Todd Ln
- 6117 Mountain Springs Ln
- 6605 English Saddle Ct
- 6488 Palisades Dr
- 6309 Trevilian Place
- 14135 Honey Hill Ct
- 13803 Fount Beattie Ct
- 6705 Cedar View Ct
- 13875 Laura Ratcliff Ct
- 6409 Noble Rock Ct
- 6413 Noble Rock Ct
- 6412 Noble Rock Ct
- 6415 Noble Rock Ct
- 6407 Noble Rock Ct
- 6414 Noble Rock Ct
- 6651 Union Mill Rd
- 6621 Union Mill Rd
- 6416 Noble Rock Ct
- 6417 Noble Rock Ct
- 6405 Noble Rock Ct
- 6408 Noble Rock Ct
- 6695 Union Mill Rd
- 6605 Rock Crystal Dr
- 6607 Rock Crystal Dr
- 6418 Noble Rock Ct
- 6603 Rock Crystal Dr
- 6609 Rock Crystal Dr
- 13703 Noble Rock Ln
- 6611 Rock Crystal Dr