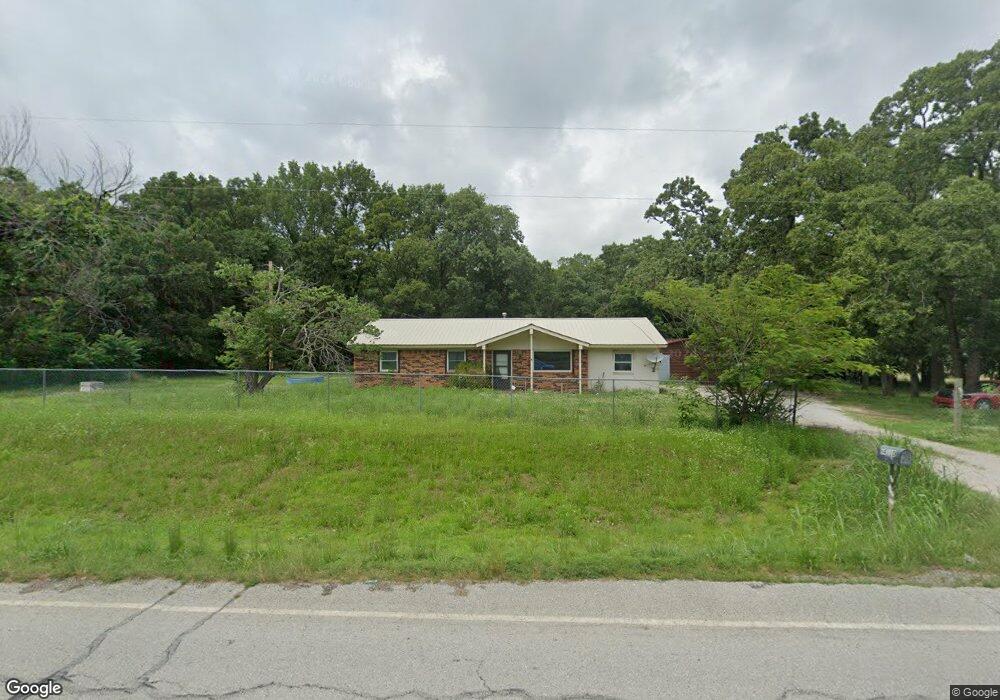
64110 E 57 Rd Quapaw, OK 74363
Estimated Value: $64,000 - $208,000
3
Beds
3
Baths
1,352
Sq Ft
$97/Sq Ft
Est. Value
About This Home
This home is located at 64110 E 57 Rd, Quapaw, OK 74363 and is currently estimated at $131,273, approximately $97 per square foot. 64110 E 57 Rd is a home located in Ottawa County with nearby schools including Quapaw Elementary School, Quapaw Middle School, and Quapaw High School.
Ownership History
Date
Name
Owned For
Owner Type
Purchase Details
Closed on
Mar 31, 2025
Sold by
Olson Jeremy E and Olsen Jeremy L
Bought by
Giveswater-Smith Joey and Greenup Cheyenne
Current Estimated Value
Home Financials for this Owner
Home Financials are based on the most recent Mortgage that was taken out on this home.
Original Mortgage
$53,600
Outstanding Balance
$52,676
Interest Rate
6.09%
Mortgage Type
New Conventional
Estimated Equity
$78,597
Purchase Details
Closed on
Nov 16, 2015
Sold by
Crane Robyn C and Olsen Robyn C
Bought by
Olsen Jeremy
Purchase Details
Closed on
Sep 30, 2013
Sold by
Dean David A and Dean Kimberly D
Bought by
Olsen Jeremy and Olsen Robyn C
Home Financials for this Owner
Home Financials are based on the most recent Mortgage that was taken out on this home.
Original Mortgage
$51,813
Interest Rate
4.46%
Mortgage Type
FHA
Purchase Details
Closed on
Nov 30, 1998
Bought by
Dean David A and Dean Kimberly
Create a Home Valuation Report for This Property
The Home Valuation Report is an in-depth analysis detailing your home's value as well as a comparison with similar homes in the area
Home Values in the Area
Average Home Value in this Area
Purchase History
| Date | Buyer | Sale Price | Title Company |
|---|---|---|---|
| Giveswater-Smith Joey | $67,000 | Photo Abstract | |
| Giveswater-Smith Joey | $67,000 | Photo Abstract | |
| Olsen Jeremy | -- | Ottawa County Abstract & Tit | |
| Olsen Jeremy | $60,000 | Ottawa County Abstract & Tit | |
| Dean David A | $53,500 | -- |
Source: Public Records
Mortgage History
| Date | Status | Borrower | Loan Amount |
|---|---|---|---|
| Open | Giveswater-Smith Joey | $53,600 | |
| Closed | Giveswater-Smith Joey | $53,600 | |
| Previous Owner | Olsen Jeremy | $51,813 |
Source: Public Records
Tax History Compared to Growth
Tax History
| Year | Tax Paid | Tax Assessment Tax Assessment Total Assessment is a certain percentage of the fair market value that is determined by local assessors to be the total taxable value of land and additions on the property. | Land | Improvement |
|---|---|---|---|---|
| 2024 | $681 | $8,229 | $770 | $7,459 |
| 2023 | $681 | $7,837 | $770 | $7,067 |
| 2022 | $634 | $7,464 | $770 | $6,694 |
| 2021 | $505 | $7,109 | $770 | $6,339 |
| 2020 | $481 | $6,770 | $770 | $6,000 |
| 2019 | $481 | $6,770 | $770 | $6,000 |
| 2018 | $481 | $6,770 | $770 | $6,000 |
| 2017 | $478 | $6,716 | $770 | $5,946 |
| 2016 | $486 | $6,840 | $713 | $6,127 |
| 2015 | $467 | $6,840 | $713 | $6,127 |
| 2014 | $487 | $6,840 | $713 | $6,127 |
Source: Public Records
Map
Nearby Homes
- 62751 E 69 Rd
- 0000 S 637 Rd
- 4461 S 650 Rd
- 5401 S 620 Rd
- 66315 E 69th Rd
- 66315 E 69 Rd
- 110 Stafford St
- 2301 S 670 Rd
- 11 Jackson St
- TBD 660 Rd
- 3991 S 600 Rd
- 65133 E 100 Rd
- 3880 S 590 Rd
- 1010 E 34th St
- 3330 Edgewood Ave
- 9021 S 614 Rd Unit Lot 4
- 3135 Shepard Ave
- 60250 E 90 Rd
- 3110 Gaineswood Ave
- 2309 S 680 Rd