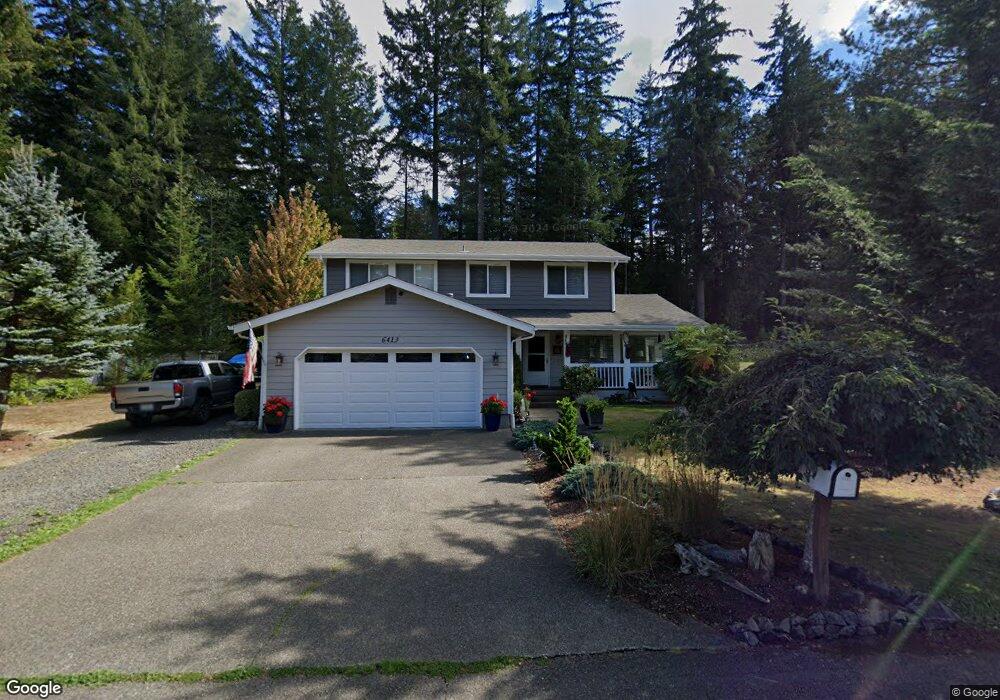
6413 Pullman Place SW Port Orchard, WA 98367
Estimated Value: $542,000 - $590,000
3
Beds
3
Baths
1,886
Sq Ft
$298/Sq Ft
Est. Value
About This Home
This home is located at 6413 Pullman Place SW, Port Orchard, WA 98367 and is currently estimated at $562,120, approximately $298 per square foot. 6413 Pullman Place SW is a home located in Kitsap County with nearby schools including Sunnyslope Elementary School, Cedar Heights Middle School, and South Kitsap High School.
Ownership History
Date
Name
Owned For
Owner Type
Purchase Details
Closed on
Apr 1, 2004
Sold by
Wolf Stephen M and Wolf Angela M
Bought by
Horan Richard J and Horan Michelle J
Current Estimated Value
Home Financials for this Owner
Home Financials are based on the most recent Mortgage that was taken out on this home.
Original Mortgage
$234,697
Outstanding Balance
$100,434
Interest Rate
4.37%
Mortgage Type
VA
Estimated Equity
$461,686
Purchase Details
Closed on
Jul 2, 1999
Sold by
Karbassi Barbara E
Bought by
Wolf Stephen M and Wolf Angela M
Home Financials for this Owner
Home Financials are based on the most recent Mortgage that was taken out on this home.
Original Mortgage
$167,850
Interest Rate
7.24%
Mortgage Type
VA
Purchase Details
Closed on
Aug 26, 1994
Sold by
Fowler Darryl
Bought by
Karbassi Barbara E
Create a Home Valuation Report for This Property
The Home Valuation Report is an in-depth analysis detailing your home's value as well as a comparison with similar homes in the area
Home Values in the Area
Average Home Value in this Area
Purchase History
| Date | Buyer | Sale Price | Title Company |
|---|---|---|---|
| Horan Richard J | $227,200 | Land Title Company | |
| Wolf Stephen M | $162,995 | Land Title Company | |
| Karbassi Barbara E | -- | Security Union Title Ins Co |
Source: Public Records
Mortgage History
| Date | Status | Borrower | Loan Amount |
|---|---|---|---|
| Open | Horan Richard J | $234,697 | |
| Previous Owner | Wolf Stephen M | $167,850 |
Source: Public Records
Tax History Compared to Growth
Tax History
| Year | Tax Paid | Tax Assessment Tax Assessment Total Assessment is a certain percentage of the fair market value that is determined by local assessors to be the total taxable value of land and additions on the property. | Land | Improvement |
|---|---|---|---|---|
| 2026 | $4,569 | $522,160 | $76,490 | $445,670 |
| 2025 | $4,569 | $522,160 | $76,490 | $445,670 |
| 2024 | $4,431 | $522,160 | $76,490 | $445,670 |
| 2023 | $4,402 | $522,160 | $76,490 | $445,670 |
| 2022 | $4,213 | $418,370 | $60,970 | $357,400 |
| 2021 | $4,006 | $376,230 | $55,430 | $320,800 |
| 2020 | $3,727 | $339,510 | $57,250 | $282,260 |
| 2019 | $3,157 | $315,220 | $52,910 | $262,310 |
| 2018 | $3,347 | $254,160 | $45,540 | $208,620 |
| 2017 | $2,807 | $254,160 | $45,540 | $208,620 |
| 2016 | $2,728 | $225,920 | $43,370 | $182,550 |
| 2015 | $2,638 | $221,310 | $43,370 | $177,940 |
| 2014 | -- | $200,800 | $42,640 | $158,160 |
| 2013 | -- | $208,550 | $50,390 | $158,160 |
Source: Public Records
Map
Nearby Homes
- 6240 SW Old Clifton Rd
- 5784 Trace Dr SW
- 6103 Trace Dr SW
- 4850 Victory Dr SW
- 6184 Lochan Rd SW Unit 375
- 6114 Lochan Rd SW Unit 370
- 6100 Lochan Rd SW Unit 369
- 4341 SW Kerbin Ln Unit 365
- 4351 SW Kerbin Ln Unit 366
- 4371 SW Kerbin Ln Unit 368
- 4370 SW Kerbin Ln Unit 377
- 6281 Crestner Dr SW Unit Lot392
- 6271 Crestner Dr SW Unit Lot393
- 6261 Crestner Dr SW Unit 394
- 6251 Crestner Dr SW Unit 405
- 6210 Crestner Dr SW Unit 358
- 6171 Crestner Dr SW Unit Lot403
- 6161 Crestner Dr SW Unit Lot404
- 6184 Talus Loop SW Unit 417
- Plan 1961 at McCormick Trails
- 6419 Pullman Place SW
- 6407 Pullman Place SW
- 6418 Pullman Place SW
- 6406 Pullman Place SW
- 6424 Pullman Place SW
- 6425 Pullman Place SW
- 6401 Pullman Place SW
- 6400 Pullman Place SW
- 6430 Pullman Place SW
- 6431 Pullman Place SW
- 6394 Pullman Place SW
- 0 Sunnyslope Rd Unit 552961
- 0 Sunnyslope Rd Unit 1117145
- 0 Sunnyslope Rd Unit 29058604
- 0 Sunnyslope Rd Unit 29058595
- 0 XXX Sunnyslope Rd SW
- 4701 Sunnyslope Rd SW
- 0 LB Sunnyslope Rd SW
- 0 LOT C Sunnyslope Rd SW
- 0 LOT 24 Sunnyslope Rd SW