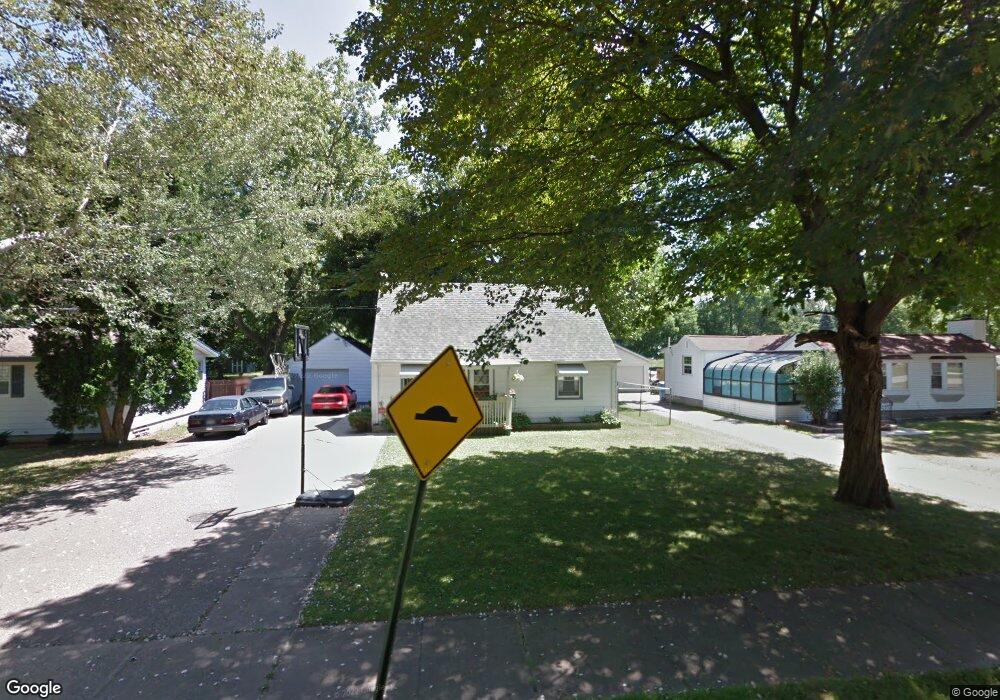
6415 Cooper Rd Lansing, MI 48911
South Lansing NeighborhoodEstimated Value: $133,693 - $173,000
4
Beds
1
Bath
960
Sq Ft
$155/Sq Ft
Est. Value
About This Home
This home is located at 6415 Cooper Rd, Lansing, MI 48911 and is currently estimated at $148,923, approximately $155 per square foot. 6415 Cooper Rd is a home located in Ingham County with nearby schools including Reo Elementary School, Attwood School, and Everett High School.
Ownership History
Date
Name
Owned For
Owner Type
Purchase Details
Closed on
Apr 4, 2008
Sold by
Collins Kevin B
Bought by
Kb & C Properties Llc
Current Estimated Value
Purchase Details
Closed on
Mar 13, 2008
Sold by
Lasalle Bank Na
Bought by
Optimal Staffing Solutions Inc
Purchase Details
Closed on
Mar 8, 2007
Sold by
Schafer Leeann Renee
Bought by
Lasalle Bank Na
Purchase Details
Closed on
Jul 26, 2001
Sold by
Bixler Mildred A
Bought by
Schafer Leeann Renee
Home Financials for this Owner
Home Financials are based on the most recent Mortgage that was taken out on this home.
Original Mortgage
$60,000
Interest Rate
10.3%
Mortgage Type
Purchase Money Mortgage
Create a Home Valuation Report for This Property
The Home Valuation Report is an in-depth analysis detailing your home's value as well as a comparison with similar homes in the area
Home Values in the Area
Average Home Value in this Area
Purchase History
| Date | Buyer | Sale Price | Title Company |
|---|---|---|---|
| Kb & C Properties Llc | -- | None Available | |
| Optimal Staffing Solutions Inc | $43,000 | Rels Title | |
| Lasalle Bank Na | $104,107 | None Available | |
| Schafer Leeann Renee | $80,000 | -- |
Source: Public Records
Mortgage History
| Date | Status | Borrower | Loan Amount |
|---|---|---|---|
| Previous Owner | Schafer Leeann Renee | $60,000 |
Source: Public Records
Tax History Compared to Growth
Tax History
| Year | Tax Paid | Tax Assessment Tax Assessment Total Assessment is a certain percentage of the fair market value that is determined by local assessors to be the total taxable value of land and additions on the property. | Land | Improvement |
|---|---|---|---|---|
| 2025 | $2,551 | $57,000 | $9,000 | $48,000 |
| 2024 | $21 | $48,600 | $9,000 | $39,600 |
| 2023 | $2,401 | $43,000 | $9,000 | $34,000 |
| 2022 | $2,193 | $32,200 | $10,900 | $21,300 |
| 2021 | $2,143 | $30,600 | $7,900 | $22,700 |
| 2020 | $2,127 | $28,300 | $7,900 | $20,400 |
| 2019 | $2,055 | $25,600 | $7,900 | $17,700 |
| 2018 | $1,949 | $25,400 | $7,900 | $17,500 |
| 2017 | $1,927 | $25,400 | $7,900 | $17,500 |
| 2016 | $3,487 | $25,000 | $7,900 | $17,100 |
| 2015 | $3,487 | $24,800 | $15,709 | $9,091 |
| 2014 | $3,487 | $24,800 | $18,717 | $6,083 |
Source: Public Records
Map
Nearby Homes
- 6301 Cooper Rd
- 6444 Sommerset Rd
- 6270 S Washington Ave
- 6263 Marywood Ave
- 6429 Rosedale Rd
- 6810 Meese Dr
- 6028 Rolfe Rd
- 6029 Ellendale Dr
- 6935 Cooper Rd
- 6947 Meese Dr
- 123 E Miller Rd
- 6955 Richard Rd
- 5821 Schafer Rd
- 1020 R G Curtiss Ave
- 354 E Miller Rd
- 2626 Sanibel Hollow
- 5636 Ellendale Dr
- 6037 Hughes Rd
- 2626 Little Hickory Dr
- 910 W Northrup St
- 6409 Cooper Rd
- 6425 Cooper Rd
- 6401 Cooper Rd
- 6433 Cooper Rd
- 6339 Cooper Rd
- 6414 Cooper Rd
- 6424 Cooper Rd
- 6400 Cooper Rd
- 6333 Cooper Rd
- 6338 Cooper Rd
- 6441 Cooper Rd
- 6408 Cooper Rd
- 6436 Cooper Rd
- 6422 Hilliard Rd
- 6327 Cooper Rd
- 6400 Hilliard Rd
- 6406 Hilliard Rd
- 6338 Hilliard Rd
- 6501 Cooper Rd
- 6321 Cooper Rd