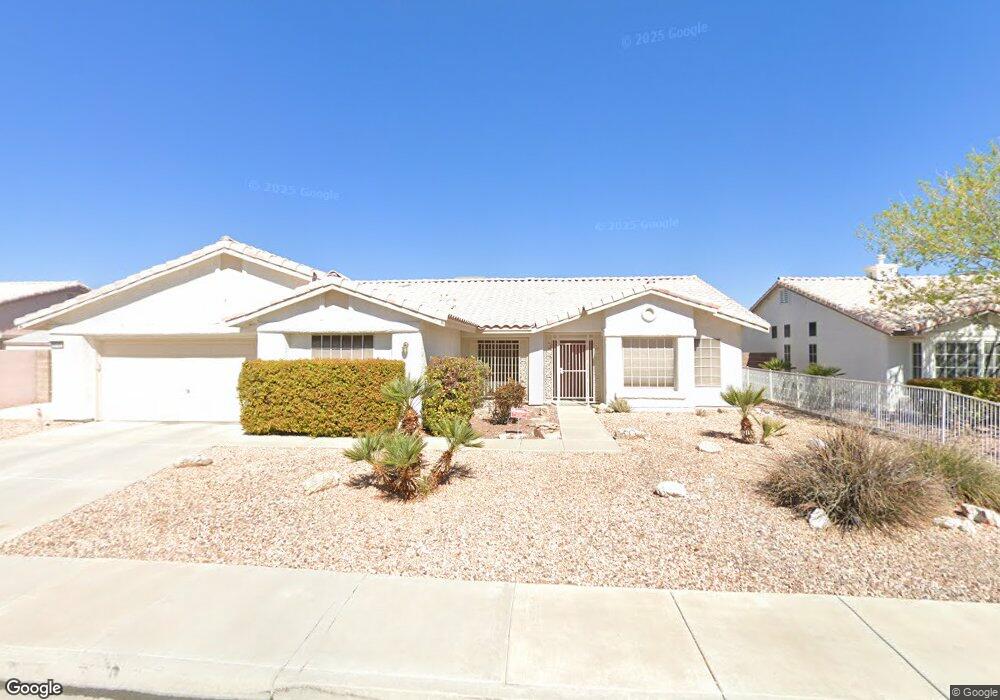
6416 Fisher Ave Unit 3 Las Vegas, NV 89130
North Cheyenne NeighborhoodEstimated Value: $519,000 - $545,000
3
Beds
2
Baths
2,140
Sq Ft
$248/Sq Ft
Est. Value
About This Home
This home is located at 6416 Fisher Ave Unit 3, Las Vegas, NV 89130 and is currently estimated at $529,818, approximately $247 per square foot. 6416 Fisher Ave Unit 3 is a home located in Clark County with nearby schools including Ernest May Elementary School, Theron L Swainston Middle School, and Shadow Ridge High School.
Ownership History
Date
Name
Owned For
Owner Type
Purchase Details
Closed on
Dec 1, 2014
Sold by
Vernic Raymond M
Bought by
Preszet Sherry
Current Estimated Value
Purchase Details
Closed on
Mar 29, 2011
Sold by
Vernic Raymond Michael
Bought by
The Cole505 Living Revocable Trust
Purchase Details
Closed on
Dec 2, 2010
Sold by
Cn Desert Properties Llc
Bought by
Vernic Raymond Michael
Purchase Details
Closed on
Sep 11, 2007
Sold by
Now Cash
Bought by
Cn Desert Properties Llc
Purchase Details
Closed on
Sep 14, 1998
Sold by
Bogart John H and Bogart Carol J
Bought by
$$ Cash Now $$ Cash Now
Purchase Details
Closed on
Dec 30, 1994
Sold by
Sportsman Park Inc
Bought by
Bogart John H and Bogart Carol J
Home Financials for this Owner
Home Financials are based on the most recent Mortgage that was taken out on this home.
Original Mortgage
$156,555
Interest Rate
9.27%
Create a Home Valuation Report for This Property
The Home Valuation Report is an in-depth analysis detailing your home's value as well as a comparison with similar homes in the area
Home Values in the Area
Average Home Value in this Area
Purchase History
| Date | Buyer | Sale Price | Title Company |
|---|---|---|---|
| Preszet Sherry | -- | None Available | |
| The Cole505 Living Revocable Trust | -- | None Available | |
| Vernic Raymond Michael | $154,500 | None Available | |
| Cn Desert Properties Llc | -- | Southwest Title | |
| $$ Cash Now $$ Cash Now | -- | National Title Company | |
| Bogart John H | $144,000 | First American Title Company |
Source: Public Records
Mortgage History
| Date | Status | Borrower | Loan Amount |
|---|---|---|---|
| Previous Owner | Bogart John H | $156,555 |
Source: Public Records
Tax History Compared to Growth
Tax History
| Year | Tax Paid | Tax Assessment Tax Assessment Total Assessment is a certain percentage of the fair market value that is determined by local assessors to be the total taxable value of land and additions on the property. | Land | Improvement |
|---|---|---|---|---|
| 2025 | $2,309 | $122,266 | $43,050 | $79,216 |
| 2024 | $2,242 | $122,266 | $43,050 | $79,216 |
| 2023 | $2,242 | $113,634 | $38,500 | $75,134 |
| 2022 | $2,177 | $99,976 | $30,800 | $69,176 |
| 2021 | $2,114 | $93,951 | $28,000 | $65,951 |
| 2020 | $2,049 | $93,615 | $28,000 | $65,615 |
| 2019 | $2,024 | $87,785 | $23,100 | $64,685 |
| 2018 | $1,932 | $85,576 | $23,100 | $62,476 |
| 2017 | $2,770 | $84,499 | $21,000 | $63,499 |
| 2016 | $1,809 | $79,594 | $15,750 | $63,844 |
| 2015 | $1,805 | $62,138 | $12,250 | $49,888 |
| 2014 | $1,752 | $51,848 | $8,750 | $43,098 |
Source: Public Records
Map
Nearby Homes
- 6405 Break Point Ave
- 6405 Steamship Ct
- 5329 Bright Sun Ct
- 6345 Citrine Ave
- 6345 Cinnabar Ridge Ave
- 6406 Veranda Falls Ct
- 6513 Echo Crest Ave
- 6301 Malachite Bay Ave
- 6540 W Hammer Ln
- 5059 Tranquil View St
- 5060 Serene Skies St
- 5508 Jasper Butte St
- 5041 Peaceful Paradise St
- 6613 Sand Bench Ave
- 6400 W Ann Rd
- 5144 Maverick St
- 6129 Desert Haven Rd
- 5005 Chambliss Dr
- 6507 Dove Point Place
- 5116 Jordan Frey St Unit 201
- 6420 Fisher Ave
- 6412 Fisher Ave
- 6413 Break Point Ave
- 6417 Break Point Ave
- 6409 Break Point Ave
- 6421 Fisher Ave
- 6424 Fisher Ave
- 6413 Fisher Ave
- 6421 Break Point Ave
- 6425 Fisher Ave
- 6416 Rancho Santa fe Dr
- 6412 Break Point Ave
- 6420 Rancho Santa fe Dr
- 6409 Fisher Ave
- 6408 Break Point Ave
- 6428 Fisher Ave
- 6429 Fisher Ave
- 6412 Rancho Santa fe Dr
- 6416 Break Point Ave
- 6425 Break Point Ave