Estimated Value: $151,000 - $189,894
Studio
--
Bath
1,326
Sq Ft
$134/Sq Ft
Est. Value
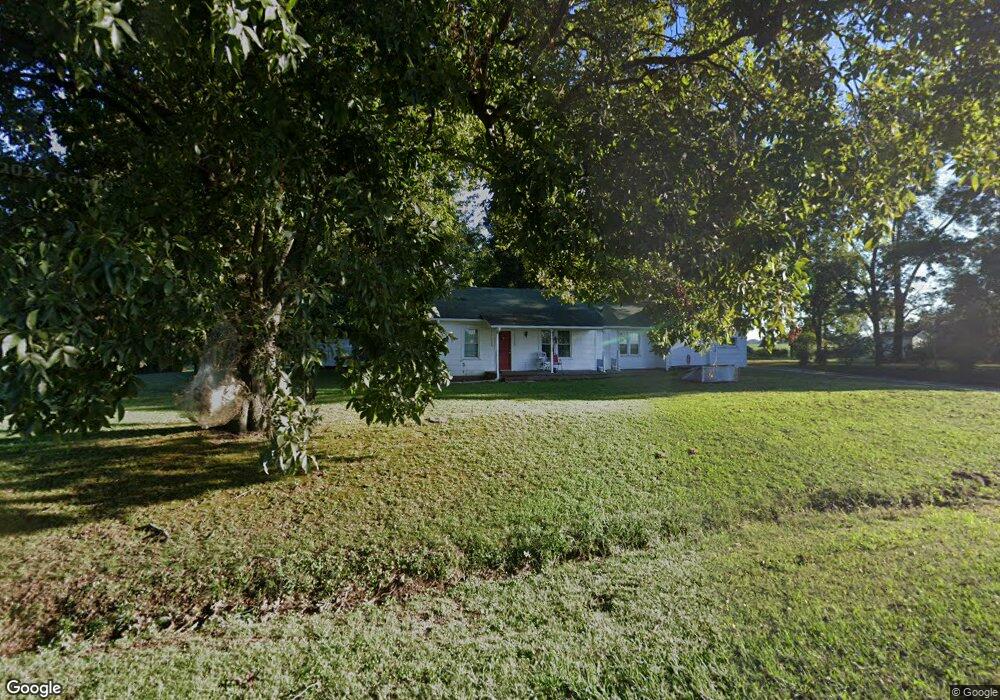
About This Home
This home is located at 6417 Old Jackson Rd, Bells, TN 38006 and is currently estimated at $177,724, approximately $134 per square foot. 6417 Old Jackson Rd is a home with nearby schools including Crockett County High School.
Ownership History
Date
Name
Owned For
Owner Type
Purchase Details
Closed on
Jan 29, 2012
Bought by
Cobb Jane P and Cobb And
Current Estimated Value
Purchase Details
Closed on
Jan 26, 2012
Sold by
Jaynes David
Bought by
Jaynes Pamela Lois
Purchase Details
Closed on
Jan 25, 2012
Sold by
Cobb Marianne
Bought by
Cobb Curtis Dean
Purchase Details
Closed on
Oct 20, 2011
Bought by
Etvir Cobb Jane P and Dean Cobb Charles
Purchase Details
Closed on
Oct 19, 2011
Bought by
Etvir Cobb Jane P and Cobb Curtis D Cobb Curtis D
Purchase Details
Closed on
Oct 18, 2011
Sold by
Cobb Charles Dean
Bought by
Cobb Curtis Dean and Cobb Marianne
Purchase Details
Closed on
Jan 27, 1992
Bought by
Cobb Jane P Etvir Charles Dean
Purchase Details
Closed on
Jun 11, 1991
Bought by
Pickins Pickins A and Pickins Pauline J
Purchase Details
Closed on
Nov 1, 1957
Bought by
Pickins Pickins A and Pickins Pauline J
Purchase Details
Closed on
Nov 18, 1939
Create a Home Valuation Report for This Property
The Home Valuation Report is an in-depth analysis detailing your home's value as well as a comparison with similar homes in the area
Purchase History
| Date | Buyer | Sale Price | Title Company |
|---|---|---|---|
| Cobb Jane P | $15,000 | -- | |
| Jaynes Pamela Lois | $22,000 | -- | |
| Cobb Curtis Dean | $22,000 | -- | |
| Cobb Curtis Dean | $45,000 | -- | |
| Etvir Cobb Jane P | $15,000 | -- | |
| Etvir Cobb Jane P | -- | -- | |
| Cobb Curtis Dean | $22,000 | -- | |
| Cobb Curtis Dean | $45,000 | -- | |
| Cobb Jane P Etvir Charles Dean | -- | -- | |
| Pickins Pickins A | -- | -- | |
| Pickins Pickins A | -- | -- | |
| -- | -- | -- |
Source: Public Records
Tax History
| Year | Tax Paid | Tax Assessment Tax Assessment Total Assessment is a certain percentage of the fair market value that is determined by local assessors to be the total taxable value of land and additions on the property. | Land | Improvement |
|---|---|---|---|---|
| 2025 | $734 | $43,200 | $23,250 | $19,950 |
| 2024 | $621 | $27,375 | $13,600 | $13,775 |
| 2023 | $609 | $27,375 | $13,600 | $13,775 |
| 2022 | $621 | $27,375 | $13,600 | $13,775 |
| 2021 | $465 | $17,600 | $7,775 | $9,825 |
| 2020 | $456 | $17,600 | $7,775 | $9,825 |
| 2019 | $465 | $17,600 | $7,775 | $9,825 |
| 2018 | $465 | $17,600 | $7,775 | $9,825 |
| 2017 | $465 | $17,600 | $7,775 | $9,825 |
| 2016 | $465 | $17,600 | $7,775 | $9,825 |
| 2015 | $432 | $17,600 | $7,775 | $9,825 |
| 2014 | $432 | $16,360 | $0 | $0 |
Source: Public Records
Map
Nearby Homes
- 115 Brooks Ln
- 1052 Dade Ellington Rd
- 2757 Edward Williams Rd
- 101 Thornfield Dr
- 44 Ginger Ln
- 115 Jaynes Rd
- 250 Bascom Rd
- 136 Mason Grove Rd
- 18232 Highway 79
- 129 Pepper Tree Rd
- 119 Bascom Rd
- 135 Windy City Rd
- 00 Windy City Rd
- 3183 Lower Jackson Rd
- 48 Harris Grove Rd
- 118 Northhaven Dr
- 30 Bentbrook Cove
- 11 Burning Tree Cove
- 15 Leisure Ln
- 80 Wrights Mill Dr
- 6387 Old Jackson Rd
- 1925 Old Jackson Rd
- 6305 Old Jackson Rd
- 1400 Old Bells Rd
- 3952 Gum Flat Rd
- 1396 Old Bells Rd
- 1382 Old Bells Rd
- 4048 Gum Flat Rd
- 6004 Old Jackson Rd
- 4172 Gum Flat Rd
- 4177 Gum Flat Rd
- 4177 Gum Flat Rd
- 4154 Gum Flat Rd
- 4245 Gum Flat Rd
- 4066 Gum Flat Rd
- 1359 Old Bells Rd Unit 1359
- 5963 Old Jackson Rd
- 5937 Old Jackson Rd
- 3982 Gum Flat Rd
- 4113 Gum Flat Rd
Your Personal Tour Guide
Ask me questions while you tour the home.