64176 Pine Tree Rd Enterprise, OR 97828
Estimated Value: $977,000 - $1,088,000
4
Beds
4
Baths
2,775
Sq Ft
$372/Sq Ft
Est. Value
About This Home
This home is located at 64176 Pine Tree Rd, Enterprise, OR 97828 and is currently estimated at $1,031,593, approximately $371 per square foot. 64176 Pine Tree Rd is a home located in Wallowa County with nearby schools including Enterprise Elementary School and Enterprise High School.
Ownership History
Date
Name
Owned For
Owner Type
Purchase Details
Closed on
Dec 4, 2023
Sold by
Beamer Family Revocable Trust
Bought by
Poppleton Twyla L and Darling Deanne L
Current Estimated Value
Purchase Details
Closed on
Jun 21, 2017
Sold by
Figgins Christopher S
Bought by
Beamer David Michael Keck and Beamer Emily Nicole
Home Financials for this Owner
Home Financials are based on the most recent Mortgage that was taken out on this home.
Original Mortgage
$220,000
Interest Rate
4.05%
Mortgage Type
New Conventional
Purchase Details
Closed on
Jul 10, 2009
Sold by
Figgins Christopher S and Figgins Heather R
Bought by
Figgins Christopher S
Home Financials for this Owner
Home Financials are based on the most recent Mortgage that was taken out on this home.
Original Mortgage
$330,000
Interest Rate
4.87%
Mortgage Type
New Conventional
Purchase Details
Closed on
Jan 20, 2006
Sold by
Reagan Kelly D and Howard Reagan Christine A
Bought by
Figgins Christopher S and Figgins Heather R
Home Financials for this Owner
Home Financials are based on the most recent Mortgage that was taken out on this home.
Original Mortgage
$280,000
Interest Rate
6.28%
Mortgage Type
New Conventional
Create a Home Valuation Report for This Property
The Home Valuation Report is an in-depth analysis detailing your home's value as well as a comparison with similar homes in the area
Home Values in the Area
Average Home Value in this Area
Purchase History
| Date | Buyer | Sale Price | Title Company |
|---|---|---|---|
| Poppleton Twyla L | -- | None Listed On Document | |
| Beamer David Michael Keck | $464,000 | Wallowa Title Company | |
| Figgins Christopher S | -- | Wallowa Title Company | |
| Figgins Christopher S | $430,000 | None Available |
Source: Public Records
Mortgage History
| Date | Status | Borrower | Loan Amount |
|---|---|---|---|
| Previous Owner | Beamer David Michael Keck | $220,000 | |
| Previous Owner | Figgins Christopher S | $330,000 | |
| Previous Owner | Figgins Christopher S | $280,000 |
Source: Public Records
Tax History Compared to Growth
Tax History
| Year | Tax Paid | Tax Assessment Tax Assessment Total Assessment is a certain percentage of the fair market value that is determined by local assessors to be the total taxable value of land and additions on the property. | Land | Improvement |
|---|---|---|---|---|
| 2024 | $3,838 | $357,056 | $210,435 | $146,621 |
| 2023 | $3,732 | $346,657 | $204,306 | $142,351 |
| 2022 | $3,612 | $336,561 | $199,373 | $137,188 |
| 2021 | $3,522 | $326,759 | $194,014 | $132,745 |
| 2020 | $3,232 | $317,242 | $188,929 | $128,313 |
| 2019 | $3,147 | $308,002 | $179,509 | $128,493 |
| 2018 | $3,063 | $299,032 | $172,952 | $126,080 |
| 2017 | $2,982 | $290,323 | $167,911 | $122,412 |
| 2016 | $2,836 | $281,867 | $0 | $0 |
| 2015 | $2,759 | $273,658 | $158,807 | $114,851 |
| 2014 | $2,685 | $265,688 | $156,857 | $108,831 |
| 2013 | $2,611 | $257,950 | $149,300 | $108,650 |
Source: Public Records
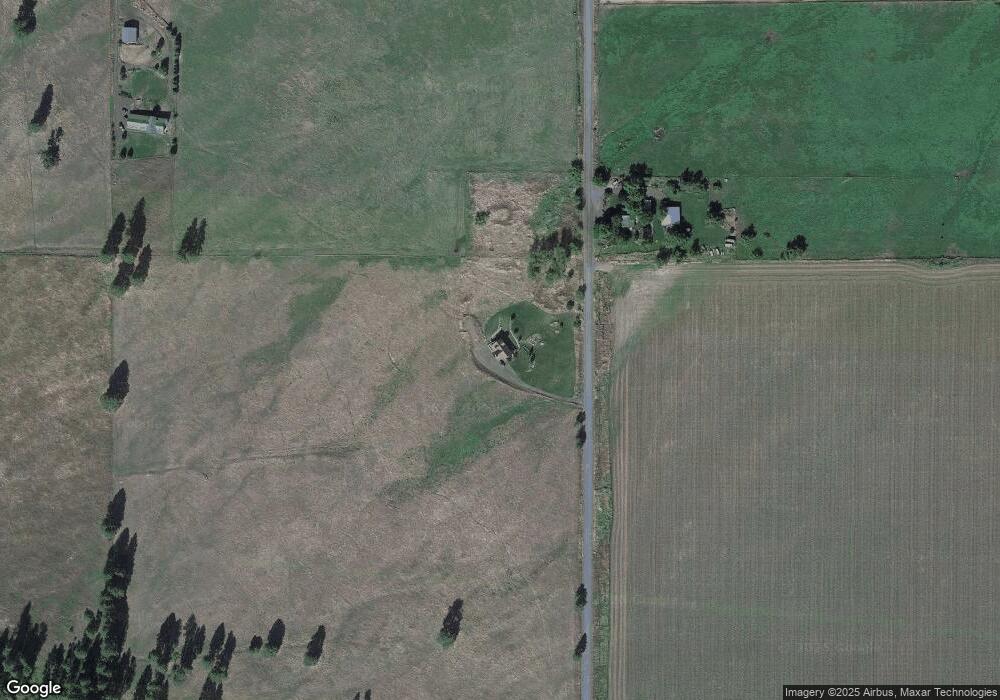
Map
Nearby Homes
- 82580 Boner Ln
- 63677 Woodland Ln
- 63677 Woodland Dr
- 82952 Eggleson Ln
- 0 Russell Ln Unit 761772670
- 204 N Russell St
- 710 N Mill St
- 0 S Main St Unit 277237767
- 0 E Daggett St
- 82757 Joseph Hwy
- 81897 Reavis Ln
- 61687 Lime Quarry Rd
- 0 Hwy 82 Main St Unit 484046347
- 104 N College St
- 802 Engleside Ave
- 19 Valley Heights Dr
- 100 W 10th St
- 502 S East St
- 118 Fish Hatchery Ln
- 0 5th St Unit 693144809
- 64213 Pine Tree Rd
- 82608 Boner Ln
- 63875 Pine Tree Rd
- 63494 Scotch Creek Rd
- 63501 Scotch Creek Rd
- 0 Scotch Creek Rd Unit 98699907
- 0 Scotch Creek Rd Unit 21212725
- 0 Scotch Creek Rd Unit 19172296
- 0 Scotch Creek Rd Unit 19120089
- 0 Scotch Creek Rd Unit 19026212
- 0 Scotch Creek Rd Unit 18016283
- 82619 Boner Ln
- 82356 Boner Ln
- 2 Scotch Creek Rd
- 82399 Ruby Peak Ln
- 63316 Scotch Creek Rd
- 82353 Boner Ln
- 82310 Ruby Peak Ln
- 63872 Pine Tree Rd