6418 141st St SW Edmonds, WA 98026
Estimated Value: $875,000 - $938,000
4
Beds
3
Baths
2,098
Sq Ft
$428/Sq Ft
Est. Value
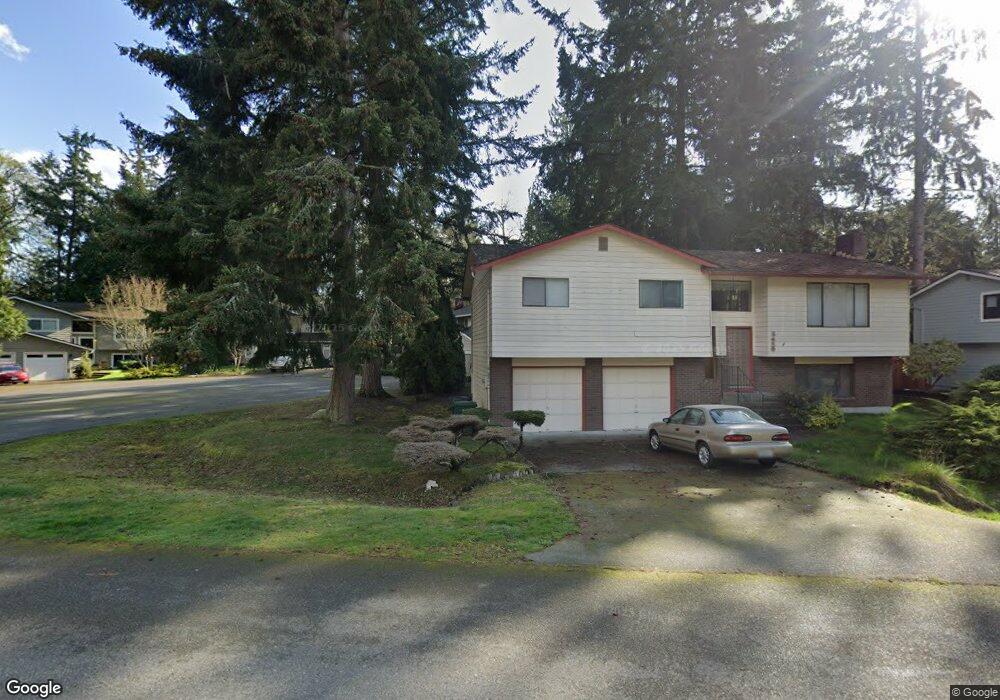
About This Home
This home is located at 6418 141st St SW, Edmonds, WA 98026 and is currently estimated at $898,127, approximately $428 per square foot. 6418 141st St SW is a home located in Snohomish County with nearby schools including Picnic Point Elementary School, Harbour Pointe Middle School, and Kamiak High School.
Ownership History
Date
Name
Owned For
Owner Type
Purchase Details
Closed on
Jun 22, 2009
Sold by
Groehnert Kirk and Groehnert Cathryn
Bought by
Hennessy John C and Hennessy Viki K
Current Estimated Value
Home Financials for this Owner
Home Financials are based on the most recent Mortgage that was taken out on this home.
Original Mortgage
$259,000
Outstanding Balance
$164,169
Interest Rate
4.83%
Mortgage Type
Purchase Money Mortgage
Estimated Equity
$733,958
Purchase Details
Closed on
Dec 4, 1998
Sold by
Quantock Corp
Bought by
Groehnert Kirk and Groehnert Cathryn
Home Financials for this Owner
Home Financials are based on the most recent Mortgage that was taken out on this home.
Original Mortgage
$170,800
Interest Rate
6.69%
Purchase Details
Closed on
Jun 2, 1998
Sold by
Dengah Ronald H
Bought by
Quantock Corp
Create a Home Valuation Report for This Property
The Home Valuation Report is an in-depth analysis detailing your home's value as well as a comparison with similar homes in the area
Home Values in the Area
Average Home Value in this Area
Purchase History
| Date | Buyer | Sale Price | Title Company |
|---|---|---|---|
| Hennessy John C | $359,000 | Rainier Title | |
| Groehnert Kirk | $213,500 | First American Title Co | |
| Quantock Corp | $155,600 | -- |
Source: Public Records
Mortgage History
| Date | Status | Borrower | Loan Amount |
|---|---|---|---|
| Open | Hennessy John C | $259,000 | |
| Previous Owner | Groehnert Kirk | $170,800 |
Source: Public Records
Tax History Compared to Growth
Tax History
| Year | Tax Paid | Tax Assessment Tax Assessment Total Assessment is a certain percentage of the fair market value that is determined by local assessors to be the total taxable value of land and additions on the property. | Land | Improvement |
|---|---|---|---|---|
| 2025 | $6,097 | $745,100 | $489,300 | $255,800 |
| 2024 | $6,097 | $721,400 | $465,600 | $255,800 |
| 2023 | $6,327 | $783,500 | $489,300 | $294,200 |
| 2022 | $5,585 | $584,000 | $319,000 | $265,000 |
| 2020 | $4,938 | $502,600 | $273,000 | $229,600 |
| 2019 | $4,651 | $475,000 | $251,000 | $224,000 |
| 2018 | $4,642 | $413,400 | $213,000 | $200,400 |
| 2017 | $4,198 | $382,400 | $197,000 | $185,400 |
| 2016 | $3,917 | $354,200 | $174,000 | $180,200 |
| 2015 | $4,102 | $340,200 | $161,000 | $179,200 |
| 2013 | $3,408 | $263,900 | $118,000 | $145,900 |
Source: Public Records
Map
Nearby Homes
- 6420 141st St SW
- 6306 141st St SW
- 13813 68th Ave W
- 6122 144th St SW
- 6625 136th Place SW
- 13802 60th Ave W
- 6520 146th St SW
- 6519 148th Place SW
- 14714 53rd Ave W Unit 116
- 14714 53rd Ave W Unit 119
- 14019 52nd Ave W Unit B
- 6509 128th Place SW
- 6523 128th Place SW
- 15424 61st Place W
- 5015 144th St SW Unit B1
- 5015 144th St SW Unit A4
- 5015 144th St SW Unit B3
- 5015 144th St SW Unit C1
- 5119 136th St SW
- 5020 148th St SW Unit E1
- 6416 141st St SW
- 6504 141st St SW
- 6414 141st St SW
- 14119 65th Place W
- 6425 142nd Place SW
- 6412 141st St SW
- 14123 65th Place W
- 6510 141st St SW
- 6509 142nd Place SW
- 14209 65th Ave W
- 6425 141st St SW
- 14128 64th Ave W
- 6515 142nd Place SW
- 14105 64th Place W
- 14120 64th Ave W
- 6431 141st St SW
- 14125 65th Place W
- 14204 64th Ave W
- 14215 65th Ave W