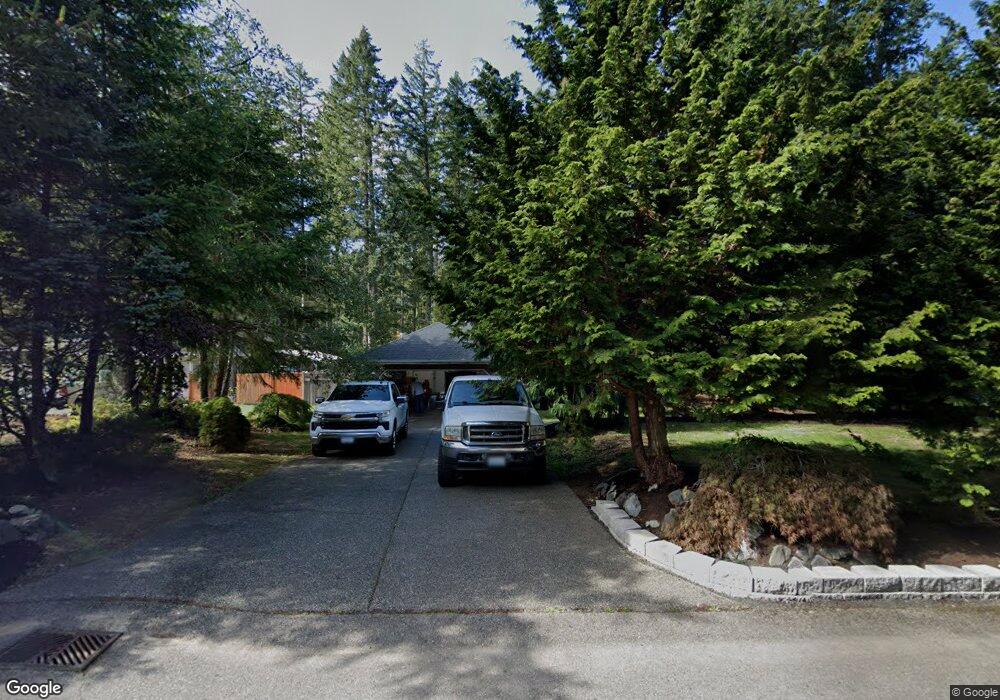
6418 Pullman Place SW Port Orchard, WA 98367
Estimated Value: $534,000 - $555,000
3
Beds
2
Baths
1,774
Sq Ft
$307/Sq Ft
Est. Value
About This Home
This home is located at 6418 Pullman Place SW, Port Orchard, WA 98367 and is currently estimated at $544,612, approximately $306 per square foot. 6418 Pullman Place SW is a home located in Kitsap County with nearby schools including Sunnyslope Elementary School, Cedar Heights Middle School, and South Kitsap High School.
Ownership History
Date
Name
Owned For
Owner Type
Purchase Details
Closed on
Apr 13, 2018
Sold by
Punihaole Tania M and Gray John L
Bought by
Gray John L
Current Estimated Value
Purchase Details
Closed on
Sep 22, 2003
Sold by
Meyerdierk Susan and Causgrove Susan
Bought by
Gray John L and Punihaole Tania M
Home Financials for this Owner
Home Financials are based on the most recent Mortgage that was taken out on this home.
Original Mortgage
$188,180
Interest Rate
6.17%
Mortgage Type
Purchase Money Mortgage
Purchase Details
Closed on
Jun 1, 2000
Sold by
Causgrove Shawn
Bought by
Causgrove Susan
Home Financials for this Owner
Home Financials are based on the most recent Mortgage that was taken out on this home.
Original Mortgage
$23,500
Interest Rate
8.16%
Mortgage Type
Seller Take Back
Create a Home Valuation Report for This Property
The Home Valuation Report is an in-depth analysis detailing your home's value as well as a comparison with similar homes in the area
Home Values in the Area
Average Home Value in this Area
Purchase History
| Date | Buyer | Sale Price | Title Company |
|---|---|---|---|
| Gray John L | $281 | None Available | |
| Gray John L | $194,000 | Transnation Title Ins Co | |
| Causgrove Susan | -- | -- |
Source: Public Records
Mortgage History
| Date | Status | Borrower | Loan Amount |
|---|---|---|---|
| Previous Owner | Gray John L | $188,180 | |
| Previous Owner | Causgrove Susan | $23,500 |
Source: Public Records
Tax History Compared to Growth
Tax History
| Year | Tax Paid | Tax Assessment Tax Assessment Total Assessment is a certain percentage of the fair market value that is determined by local assessors to be the total taxable value of land and additions on the property. | Land | Improvement |
|---|---|---|---|---|
| 2026 | $4,043 | $460,170 | $76,290 | $383,880 |
| 2025 | $4,043 | $460,170 | $76,290 | $383,880 |
| 2024 | $3,921 | $460,170 | $76,290 | $383,880 |
| 2023 | $3,895 | $460,170 | $76,290 | $383,880 |
| 2022 | $3,723 | $368,270 | $60,810 | $307,460 |
| 2021 | $3,536 | $330,750 | $55,280 | $275,470 |
| 2020 | $3,593 | $327,010 | $57,100 | $269,910 |
| 2019 | $3,040 | $303,110 | $52,780 | $250,330 |
| 2018 | $3,221 | $244,010 | $45,420 | $198,590 |
| 2017 | $2,699 | $244,010 | $45,420 | $198,590 |
| 2016 | $2,638 | $216,670 | $43,260 | $173,410 |
| 2015 | $2,554 | $212,480 | $43,260 | $169,220 |
| 2014 | -- | $186,790 | $42,500 | $144,290 |
| 2013 | -- | $194,510 | $50,220 | $144,290 |
Source: Public Records
Map
Nearby Homes
- 6388 Pullman Place SW
- 6240 SW Old Clifton Rd
- 5925 Addison Rd SW Unit 100
- 5131 Southgate Dr SW
- 6150 SW Rhododendron Dr
- 4850 Victory Dr SW
- 6114 Lochan Rd SW
- 5846 SW 44th St
- 4341 SW Kerbin Ln Unit 365
- 4370 SW Kerbin Ln Unit 377
- 4351 SW Kerbin Ln Unit 366
- Plan A-330 at McCormick Trails
- Plan A-300 at McCormick Trails
- Plan A-280 at McCormick Trails
- 4520 Victory Place SW
- 6120 Crestner Dr SW
- Plan 2457 at McCormick Trails
- Plan 2141 at McCormick Trails
- Plan 1961 at McCormick Trails
- Aurora Plan at McCormick Trails
- 6424 Pullman Place SW
- 6413 Pullman Place SW
- 6430 Pullman Place SW
- 6419 Pullman Place SW
- 6406 Pullman Place SW
- 6425 Pullman Place SW
- 6407 Pullman Place SW
- 6481 Crossing Place SW
- 6475 Crossing Place SW
- 6400 Pullman Place SW
- 6487 Crossing Place SW
- 6469 Crossing Place SW
- 6431 Pullman Place SW
- 6401 Pullman Place SW
- 6463 Crossing Place SW
- 6394 Pullman Place SW
- 6457 Crossing Place SW
- 6480 Crossing Place SW
- 6474 Crossing Place SW
- 6486 Crossing Place SW