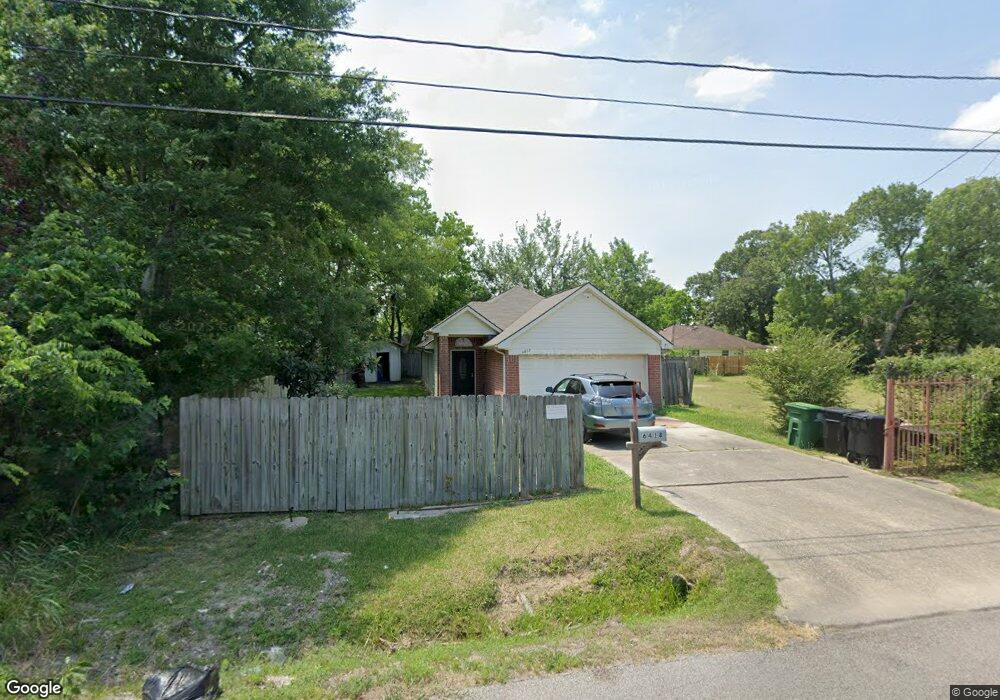
6418 Sidney St Houston, TX 77021
OST-South Union NeighborhoodEstimated Value: $209,524 - $239,000
3
Beds
2
Baths
1,163
Sq Ft
$189/Sq Ft
Est. Value
About This Home
This home is located at 6418 Sidney St, Houston, TX 77021 and is currently estimated at $219,381, approximately $188 per square foot. 6418 Sidney St is a home located in Harris County with nearby schools including Peck Elementary School, Cullen Middle School, and Yates High School.
Ownership History
Date
Name
Owned For
Owner Type
Purchase Details
Closed on
Sep 18, 2012
Sold by
Secretary Of Hud
Bought by
Hodges Kimberly
Current Estimated Value
Home Financials for this Owner
Home Financials are based on the most recent Mortgage that was taken out on this home.
Original Mortgage
$65,900
Outstanding Balance
$45,985
Interest Rate
3.75%
Mortgage Type
FHA
Estimated Equity
$173,396
Purchase Details
Closed on
Feb 24, 2012
Sold by
Roman Raymundo and Roman Josefa
Bought by
Bank Of America Na
Purchase Details
Closed on
Feb 22, 2012
Sold by
Bank Of America Na
Bought by
The Secretary Of Hud
Purchase Details
Closed on
May 2, 2006
Sold by
Roman Raymundo
Bought by
Roman Armando
Purchase Details
Closed on
Apr 30, 2003
Sold by
Texas Colonial Homes Lp
Bought by
Roman Raymundo
Home Financials for this Owner
Home Financials are based on the most recent Mortgage that was taken out on this home.
Original Mortgage
$90,100
Interest Rate
5.8%
Mortgage Type
FHA
Create a Home Valuation Report for This Property
The Home Valuation Report is an in-depth analysis detailing your home's value as well as a comparison with similar homes in the area
Home Values in the Area
Average Home Value in this Area
Purchase History
| Date | Buyer | Sale Price | Title Company |
|---|---|---|---|
| Hodges Kimberly | -- | None Available | |
| Bank Of America Na | $88,650 | None Available | |
| The Secretary Of Hud | -- | None Available | |
| Roman Armando | -- | None Available | |
| Roman Raymundo | -- | Stewart Title | |
| Texas Colonial Homes Lp | -- | Stewart Title |
Source: Public Records
Mortgage History
| Date | Status | Borrower | Loan Amount |
|---|---|---|---|
| Open | Hodges Kimberly | $65,900 | |
| Previous Owner | Roman Raymundo | $90,100 | |
| Closed | Roman Raymundo | $9,500 |
Source: Public Records
Tax History Compared to Growth
Tax History
| Year | Tax Paid | Tax Assessment Tax Assessment Total Assessment is a certain percentage of the fair market value that is determined by local assessors to be the total taxable value of land and additions on the property. | Land | Improvement |
|---|---|---|---|---|
| 2025 | $1,707 | $245,704 | $90,000 | $155,704 |
| 2024 | $1,707 | $234,366 | $90,000 | $144,366 |
| 2023 | $1,707 | $209,208 | $90,000 | $119,208 |
| 2022 | $2,795 | $223,162 | $70,000 | $153,162 |
| 2021 | $2,690 | $179,415 | $45,000 | $134,415 |
| 2020 | $2,541 | $115,319 | $30,000 | $85,319 |
| 2019 | $2,414 | $98,303 | $25,000 | $73,303 |
| 2018 | $1,462 | $107,181 | $20,000 | $87,181 |
| 2017 | $1,993 | $107,181 | $20,000 | $87,181 |
| 2016 | $1,812 | $90,760 | $20,000 | $70,760 |
| 2015 | $1,045 | $86,241 | $20,000 | $66,241 |
| 2014 | $1,045 | $59,226 | $12,500 | $46,726 |
Source: Public Records
Map
Nearby Homes
- 6403 Goforth St
- 6418 England St
- 6401 Goforth St
- 6834 Foster St
- 0 Sidney St Unit 28682136
- 6405 Conley St
- 0 Belvedere St Unit 84653424
- 0 St Augustine St Unit 38469599
- 6417 Saint Augustine St
- 6301 Eastwood St
- 0 Mt Pleasant St Unit 30800007
- 4520 Yellowstone Blvd
- 0 Stearns Unit 28305136
- 6418 Saint Augustine St
- 6631 Foster St
- 0 Cullen Blvd
- 5910 Cullen Blvd
- 6602 Cullen Blvd
- 6305 Eastwood St
- 6208 Sidney St
- 6420 Sidney St Unit B
- 6420 Sidney St Unit A
- 6420 Sidney St
- 6416 Sidney St
- 6415 England St
- 6419 England St
- 6411 England St
- 6423 England St
- 6409 England St
- 6426 Sidney St
- 6406 Sidney St
- 6413 Sidney St
- 6427 England St
- 6411 Sidney St
- 6421 Sidney St
- 6402 Sidney St
- 4206 Cosby St
- 6425 Sidney St
- 6407 Sidney St
- 6502 Sidney St