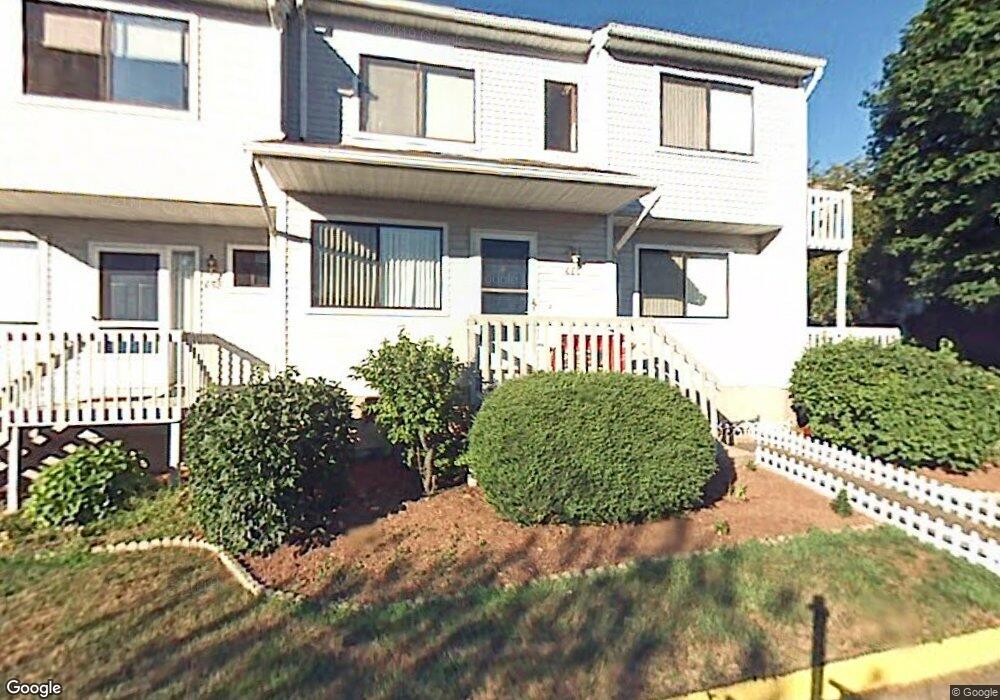
642 Cypress Rd Newington, CT 06111
Estimated Value: $260,000 - $278,000
2
Beds
2
Baths
1,250
Sq Ft
$214/Sq Ft
Est. Value
About This Home
This home is located at 642 Cypress Rd, Newington, CT 06111 and is currently estimated at $267,333, approximately $213 per square foot. 642 Cypress Rd is a home located in Hartford County with nearby schools including Ruth Chaffee School, John Wallace Middle School, and Newington High School.
Ownership History
Date
Name
Owned For
Owner Type
Purchase Details
Closed on
Jul 13, 2018
Sold by
Margelony James and Tremblay Michelle
Bought by
Pereira Selwyn S
Current Estimated Value
Purchase Details
Closed on
Jan 25, 2016
Sold by
Trombley Colleen M
Bought by
Margelony James and Tremblay Michelle
Home Financials for this Owner
Home Financials are based on the most recent Mortgage that was taken out on this home.
Original Mortgage
$144,337
Interest Rate
3.75%
Mortgage Type
FHA
Purchase Details
Closed on
Jun 2, 2008
Sold by
Nguyen Thien V
Bought by
Grgach Christopher and Mosher Colleen
Home Financials for this Owner
Home Financials are based on the most recent Mortgage that was taken out on this home.
Original Mortgage
$181,157
Interest Rate
5.91%
Purchase Details
Closed on
Mar 1, 2000
Sold by
Randazzo Joseph C and Randazo Pamela L
Bought by
Nguyen Thien
Create a Home Valuation Report for This Property
The Home Valuation Report is an in-depth analysis detailing your home's value as well as a comparison with similar homes in the area
Home Values in the Area
Average Home Value in this Area
Purchase History
| Date | Buyer | Sale Price | Title Company |
|---|---|---|---|
| Pereira Selwyn S | $136,000 | -- | |
| Margelony James | $147,000 | -- | |
| Grgach Christopher | $184,000 | -- | |
| Nguyen Thien | $87,000 | -- |
Source: Public Records
Mortgage History
| Date | Status | Borrower | Loan Amount |
|---|---|---|---|
| Previous Owner | Margelony James | $144,337 | |
| Previous Owner | Nguyen Thien | $181,784 | |
| Previous Owner | Nguyen Thien | $182,906 | |
| Previous Owner | Nguyen Thien | $181,157 | |
| Previous Owner | Nguyen Thien | $69,849 |
Source: Public Records
Tax History
| Year | Tax Paid | Tax Assessment Tax Assessment Total Assessment is a certain percentage of the fair market value that is determined by local assessors to be the total taxable value of land and additions on the property. | Land | Improvement |
|---|---|---|---|---|
| 2025 | $3,835 | $95,930 | $0 | $95,930 |
| 2024 | $3,806 | $95,930 | $0 | $95,930 |
| 2023 | $3,680 | $95,930 | $0 | $95,930 |
| 2022 | $3,692 | $95,930 | $0 | $95,930 |
| 2021 | $3,723 | $95,930 | $0 | $95,930 |
| 2020 | $3,926 | $99,950 | $0 | $99,950 |
| 2019 | $3,943 | $99,950 | $0 | $99,950 |
| 2018 | $3,848 | $99,950 | $0 | $99,950 |
| 2017 | $3,657 | $99,950 | $0 | $99,950 |
| 2016 | $3,573 | $99,950 | $0 | $99,950 |
| 2015 | $3,868 | $108,040 | $0 | $108,040 |
| 2014 | $3,757 | $108,040 | $0 | $108,040 |
Source: Public Records
Map
Nearby Homes
- 378 Cypress Rd
- 229 Cottonwood Rd Unit 229
- 15 Woodsedge Dr Unit 5C
- 35 Woodsedge Dr Unit 4C
- 138 Cypress Rd Unit 138
- 6 Vinnie Dr
- 61 Luca Ln
- 76 Luca Lane Homesite 8
- 8 Stella Dr
- 417 Churchill Dr Unit 417
- 144 Churchill Dr
- 62 Harold Dr
- 2 Deming Farm Dr Unit 2
- 18 Stone Hill Dr
- 3 Steeplechase Dr
- 5 Robeth Ln
- 2950 Berlin Turnpike
- 508 Highland St
- 155 Old Common Rd
- 2990 Berlin Turnpike
- 630 Cypress Rd
- 632 Cypress Rd
- 642 Cypress Rd Unit 642
- 624 Cypress Rd
- 626 Cypress Rd
- 636 Cypress Rd
- 634 Cypress Rd
- 638 Cypress Rd
- 628 Cypress Rd
- 618 Cypress Rd
- 618 Cypress Rd Unit 618
- 616 Cypress Rd
- 616 Cypress Rd Unit 616
- 598 Cypress Rd
- 596 Cypress Rd
- 584 Cypress Rd
- 594 Cypress Rd
- 600 Cypress Rd
- 600 Cypress Rd Unit 600
- 586 Cypress Rd
Your Personal Tour Guide
Ask me questions while you tour the home.