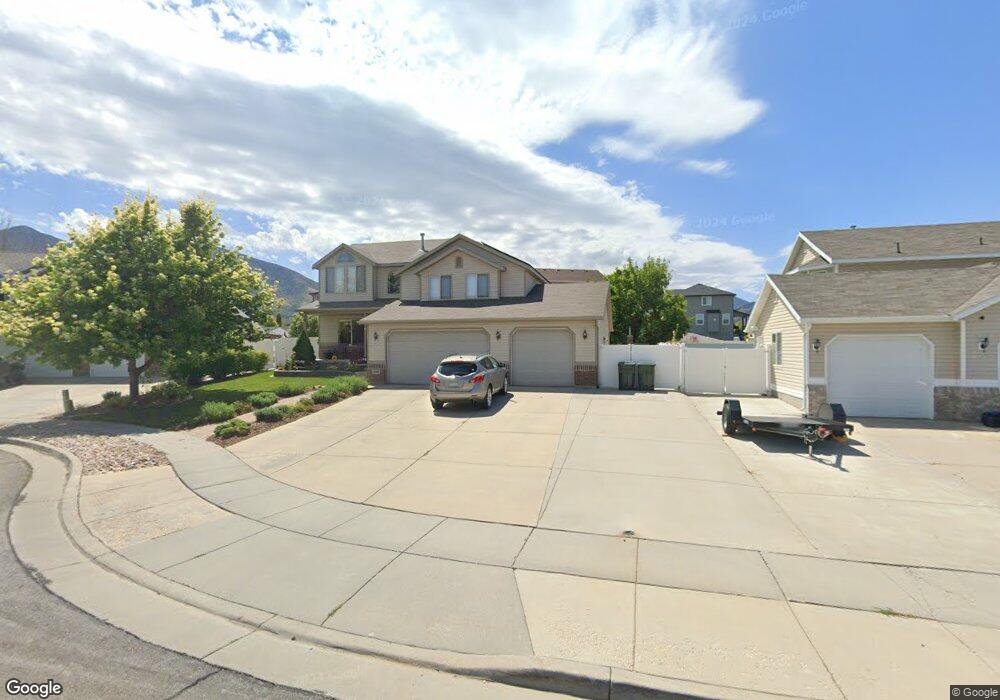
642 E 1290 N Tooele, UT 84074
Estimated Value: $519,000 - $574,000
6
Beds
4
Baths
2,700
Sq Ft
$201/Sq Ft
Est. Value
About This Home
This home is located at 642 E 1290 N, Tooele, UT 84074 and is currently estimated at $542,592, approximately $200 per square foot. 642 E 1290 N is a home located in Tooele County with nearby schools including Copper Canyon Elementary School, Clarke N. Johnsen Junior High School, and Stansbury High School.
Ownership History
Date
Name
Owned For
Owner Type
Purchase Details
Closed on
Mar 2, 2021
Sold by
Wilcox Matthew I
Bought by
Wilcox Matthew I and Wilcox Jennilyn
Current Estimated Value
Purchase Details
Closed on
Jun 13, 2016
Sold by
Parsons David and Parsons Sherri
Bought by
Wilcox Matthew I
Home Financials for this Owner
Home Financials are based on the most recent Mortgage that was taken out on this home.
Original Mortgage
$264,127
Outstanding Balance
$210,830
Interest Rate
3.66%
Mortgage Type
FHA
Estimated Equity
$331,762
Purchase Details
Closed on
Sep 23, 2005
Sold by
Maple Hills 3 Development Llc
Bought by
Parsons David and Parsons Sherri
Create a Home Valuation Report for This Property
The Home Valuation Report is an in-depth analysis detailing your home's value as well as a comparison with similar homes in the area
Home Values in the Area
Average Home Value in this Area
Purchase History
| Date | Buyer | Sale Price | Title Company |
|---|---|---|---|
| Wilcox Matthew I | -- | Accommodation | |
| Wilcox Matthew I | -- | Inwest Title Tooele | |
| Parsons David | -- | Merrill Title Company |
Source: Public Records
Mortgage History
| Date | Status | Borrower | Loan Amount |
|---|---|---|---|
| Open | Wilcox Matthew I | $264,127 |
Source: Public Records
Tax History Compared to Growth
Tax History
| Year | Tax Paid | Tax Assessment Tax Assessment Total Assessment is a certain percentage of the fair market value that is determined by local assessors to be the total taxable value of land and additions on the property. | Land | Improvement |
|---|---|---|---|---|
| 2025 | $3,594 | $299,800 | $60,500 | $239,300 |
| 2024 | $3,931 | $300,026 | $60,500 | $239,526 |
| 2023 | $3,931 | $285,618 | $57,608 | $228,010 |
| 2022 | $3,276 | $281,832 | $58,094 | $223,738 |
| 2021 | $2,715 | $195,344 | $23,238 | $172,106 |
| 2020 | $2,577 | $321,643 | $42,250 | $279,393 |
| 2019 | $2,511 | $308,339 | $42,250 | $266,089 |
| 2018 | $2,323 | $270,499 | $45,000 | $225,499 |
| 2017 | $1,933 | $267,120 | $30,000 | $237,120 |
| 2016 | $1,564 | $129,905 | $16,500 | $113,405 |
| 2015 | $1,564 | $113,778 | $0 | $0 |
| 2014 | -- | $113,778 | $0 | $0 |
Source: Public Records
Map
Nearby Homes