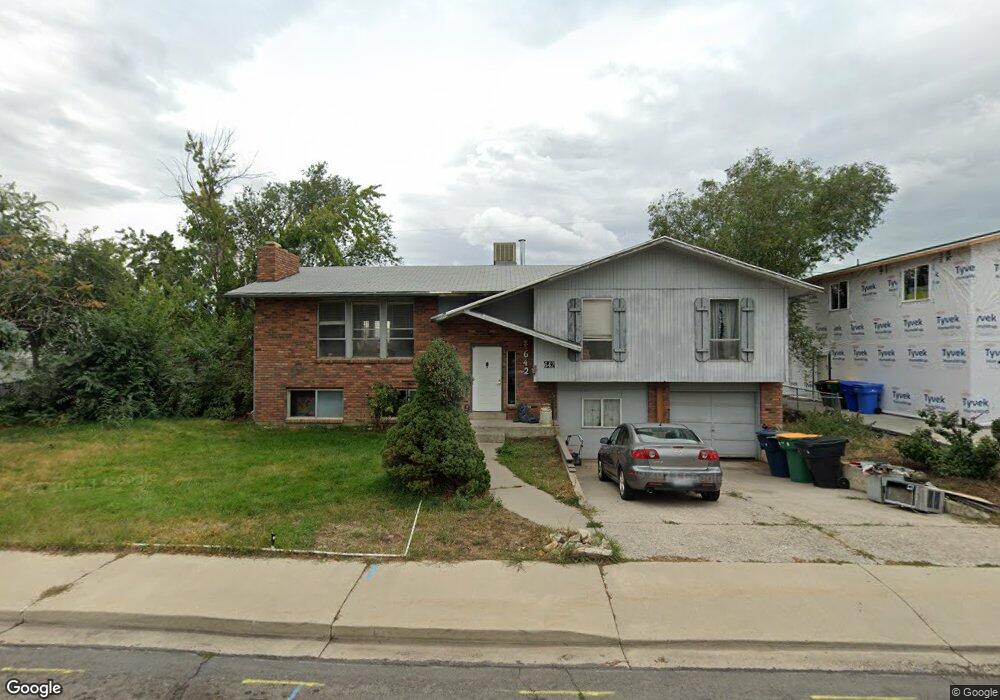
642 E 660 N Orem, UT 84097
Orchard South NeighborhoodEstimated Value: $492,685 - $538,000
3
Beds
2
Baths
1,448
Sq Ft
$357/Sq Ft
Est. Value
About This Home
This home is located at 642 E 660 N, Orem, UT 84097 and is currently estimated at $516,895, approximately $356 per square foot. 642 E 660 N is a home located in Utah County with nearby schools including Foothill Elementary School, Canyon View Junior High School, and Orem High School.
Ownership History
Date
Name
Owned For
Owner Type
Purchase Details
Closed on
Jul 11, 2020
Sold by
Nebeker John R and Nebeker John R
Bought by
Nebeker John R
Current Estimated Value
Home Financials for this Owner
Home Financials are based on the most recent Mortgage that was taken out on this home.
Original Mortgage
$206,909
Interest Rate
3.1%
Mortgage Type
FHA
Purchase Details
Closed on
Oct 20, 2010
Sold by
Nebeker John R
Bought by
Nebeker John Robert
Home Financials for this Owner
Home Financials are based on the most recent Mortgage that was taken out on this home.
Original Mortgage
$229,358
Interest Rate
4.5%
Mortgage Type
FHA
Purchase Details
Closed on
Oct 1, 2007
Sold by
Nebeker John Robert Christian and Nebeker Cindy Lou
Bought by
Nebeker John R
Home Financials for this Owner
Home Financials are based on the most recent Mortgage that was taken out on this home.
Original Mortgage
$226,598
Interest Rate
6.46%
Mortgage Type
New Conventional
Create a Home Valuation Report for This Property
The Home Valuation Report is an in-depth analysis detailing your home's value as well as a comparison with similar homes in the area
Home Values in the Area
Average Home Value in this Area
Purchase History
| Date | Buyer | Sale Price | Title Company |
|---|---|---|---|
| Nebeker John R | -- | Netco Inc | |
| Nebeker John Robert | -- | Gt Title Services Salt La | |
| Nebeker John R | -- | Millcreek Land Title Ins |
Source: Public Records
Mortgage History
| Date | Status | Borrower | Loan Amount |
|---|---|---|---|
| Previous Owner | Nebeker John R | $206,909 | |
| Previous Owner | Nebeker John Robert | $229,358 | |
| Previous Owner | Nebeker John R | $226,598 |
Source: Public Records
Tax History
| Year | Tax Paid | Tax Assessment Tax Assessment Total Assessment is a certain percentage of the fair market value that is determined by local assessors to be the total taxable value of land and additions on the property. | Land | Improvement |
|---|---|---|---|---|
| 2025 | $1,980 | $246,455 | -- | -- |
| 2024 | $1,980 | $242,110 | $0 | $0 |
| 2023 | $1,867 | $245,355 | $0 | $0 |
| 2022 | $1,924 | $245,025 | $0 | $0 |
| 2021 | $1,794 | $345,900 | $141,900 | $204,000 |
| 2020 | $1,654 | $313,500 | $113,500 | $200,000 |
| 2019 | $1,510 | $297,600 | $106,400 | $191,200 |
| 2018 | $1,486 | $279,800 | $102,900 | $176,900 |
| 2017 | $1,414 | $142,615 | $0 | $0 |
| 2016 | $1,488 | $138,435 | $0 | $0 |
| 2015 | $1,450 | $127,545 | $0 | $0 |
| 2014 | $1,452 | $127,160 | $0 | $0 |
Source: Public Records
Map
Nearby Homes
Your Personal Tour Guide
Ask me questions while you tour the home.