642 Lee Ave Saint Louis, MO 63119
Estimated Value: $1,018,000 - $1,157,000
4
Beds
4
Baths
3,524
Sq Ft
$309/Sq Ft
Est. Value
About This Home
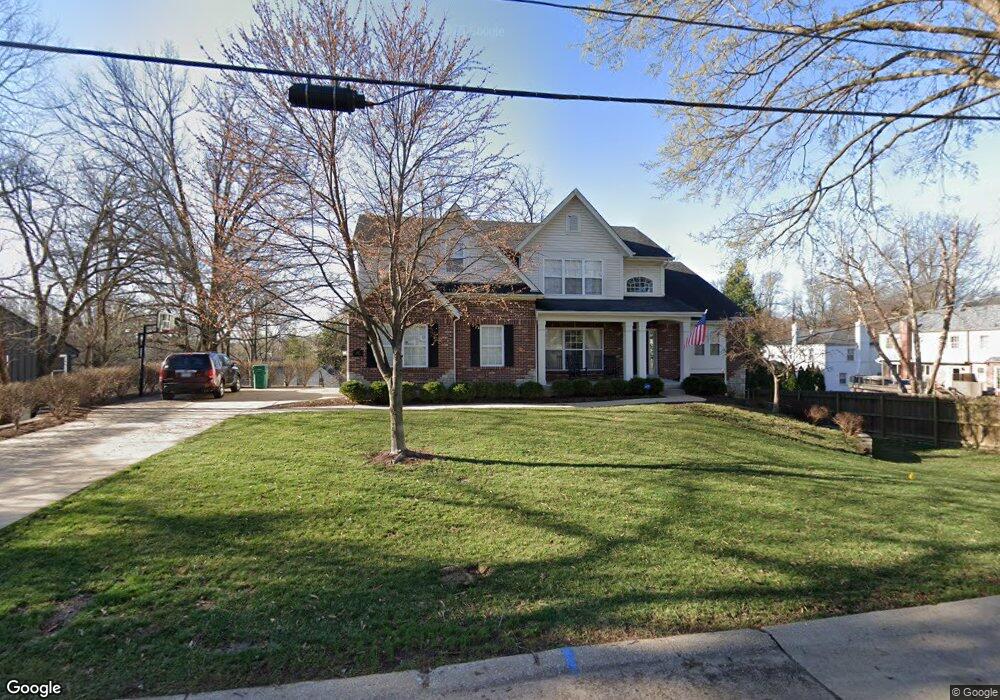
This home is located at 642 Lee Ave, Saint Louis, MO 63119 and is currently estimated at $1,087,494, approximately $308 per square foot. 642 Lee Ave is a home located in St. Louis County with nearby schools including Bristol Elementary School, Hixson Middle School, and Webster Groves High School.
Ownership History
Date
Name
Owned For
Owner Type
Purchase Details
Closed on
Feb 19, 2009
Sold by
Mayer Custom Homes Inc
Bought by
Moore Robert C and Moore Suzanne J
Current Estimated Value
Home Financials for this Owner
Home Financials are based on the most recent Mortgage that was taken out on this home.
Original Mortgage
$215,000
Outstanding Balance
$134,519
Interest Rate
4.91%
Mortgage Type
Credit Line Revolving
Estimated Equity
$952,975
Purchase Details
Closed on
Oct 23, 2007
Sold by
Hurth Sarah L
Bought by
Mayor Manors Inc
Purchase Details
Closed on
Apr 26, 2000
Sold by
Livin Edwin F and Livin Claire S Miner Revocable
Bought by
Hurth Sarah L
Home Financials for this Owner
Home Financials are based on the most recent Mortgage that was taken out on this home.
Original Mortgage
$100,000
Interest Rate
8.37%
Purchase Details
Closed on
Nov 13, 1998
Sold by
Miner Edwin F and Miner Claire S
Bought by
Miner Edwin F and Miner Claire S
Create a Home Valuation Report for This Property
The Home Valuation Report is an in-depth analysis detailing your home's value as well as a comparison with similar homes in the area
Home Values in the Area
Average Home Value in this Area
Purchase History
| Date | Buyer | Sale Price | Title Company |
|---|---|---|---|
| Moore Robert C | $621,219 | Multiple | |
| Mayor Manors Inc | $153,750 | Sec | |
| Hurth Sarah L | $156,000 | -- | |
| Miner Edwin F | -- | -- |
Source: Public Records
Mortgage History
| Date | Status | Borrower | Loan Amount |
|---|---|---|---|
| Open | Moore Robert C | $215,000 | |
| Closed | Moore Robert C | $250,000 | |
| Previous Owner | Hurth Sarah L | $100,000 |
Source: Public Records
Tax History Compared to Growth
Tax History
| Year | Tax Paid | Tax Assessment Tax Assessment Total Assessment is a certain percentage of the fair market value that is determined by local assessors to be the total taxable value of land and additions on the property. | Land | Improvement |
|---|---|---|---|---|
| 2025 | $10,187 | $190,460 | $60,040 | $130,420 |
| 2024 | $10,187 | $148,220 | $50,030 | $98,190 |
| 2023 | $10,217 | $148,220 | $50,030 | $98,190 |
| 2022 | $9,027 | $121,560 | $36,020 | $85,540 |
| 2021 | $8,996 | $121,560 | $36,020 | $85,540 |
| 2020 | $9,526 | $119,950 | $34,790 | $85,160 |
| 2019 | $9,457 | $119,950 | $34,790 | $85,160 |
| 2018 | $9,376 | $105,620 | $27,190 | $78,430 |
| 2017 | $9,313 | $105,620 | $27,190 | $78,430 |
| 2016 | $8,538 | $92,590 | $19,530 | $73,060 |
| 2015 | $8,588 | $92,590 | $19,530 | $73,060 |
| 2014 | $8,524 | $89,420 | $15,600 | $73,820 |
Source: Public Records
Map
Nearby Homes
- 28 Berry Road Park
- 827 Yosemite Dr
- 541 W Kirkham Ave
- 529 Cyril Dr
- 426 W Kirkham Ave
- 9721 Greenwood Terrace
- 404 W Kirkham Ave
- 1025 Glenmoor Ln
- 336 Madison Ave
- 987 Dwyer Ave
- 939 Victoria Place
- 330 Lithia Ave
- 218 Euclid Ave
- 946 Dwyer Ave
- 65 Ridge Line Dr
- 931 Brownell Ave
- 1095 N Sappington Rd
- 1048 Martha Ln
- 144 S Rock Hill Rd
- 423 Parkland Ave
- 634 Lee Ave
- 30 Berry Road Park
- 655 Foote Ave
- 649 Foote Ave
- 26 Berry Road Park
- 32 Berry Road Park
- 643 Foote Ave
- 628 Lee Ave
- 639 Lee Ave
- 34 Berry Road Park
- 633 Lee Ave
- 637 Foote Ave
- 629 Lee Ave
- 22 Berry Road Park
- 179 Hammel Ave
- 29 Berry Road Park
- 25 Berry Road Park
- 36 Berry Road Park
- 616 Lee Ave
- 51 Cheyenne Ct