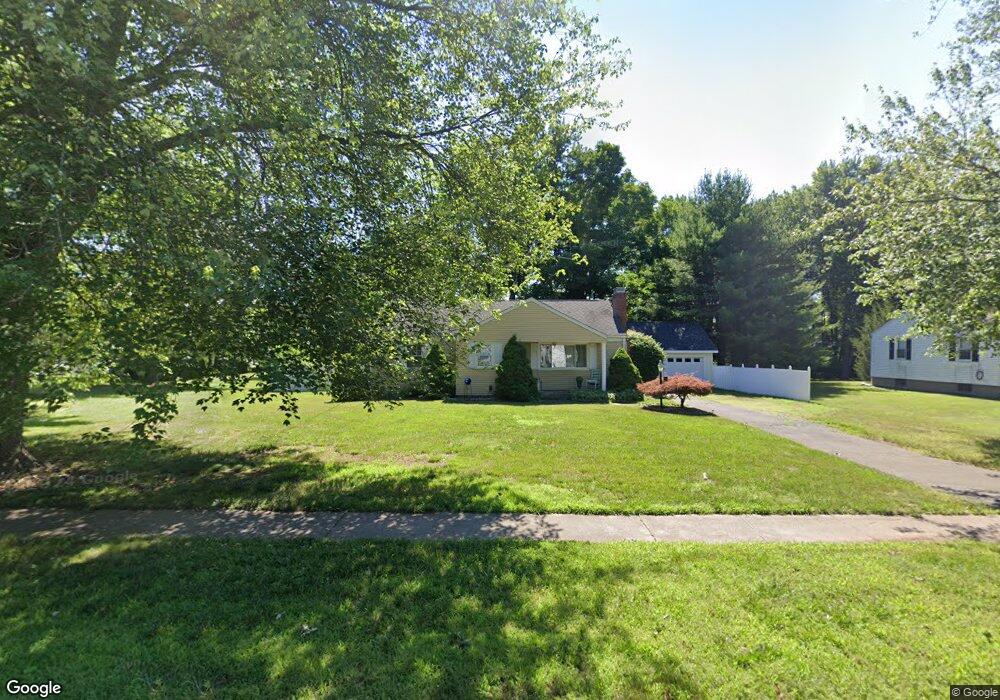
642 Maple St Wethersfield, CT 06109
Estimated Value: $374,000 - $444,000
3
Beds
2
Baths
1,208
Sq Ft
$340/Sq Ft
Est. Value
About This Home
This home is located at 642 Maple St, Wethersfield, CT 06109 and is currently estimated at $411,270, approximately $340 per square foot. 642 Maple St is a home located in Hartford County with nearby schools including Highcrest School, Silas Deane Middle School, and Wethersfield High School.
Ownership History
Date
Name
Owned For
Owner Type
Purchase Details
Closed on
Jul 11, 2022
Sold by
Phillbrink William S
Bought by
Phillbrick Krystina M
Current Estimated Value
Home Financials for this Owner
Home Financials are based on the most recent Mortgage that was taken out on this home.
Original Mortgage
$198,335
Outstanding Balance
$188,920
Interest Rate
5.23%
Mortgage Type
Stand Alone Refi Refinance Of Original Loan
Estimated Equity
$222,350
Purchase Details
Closed on
Jul 7, 2011
Sold by
Caruso Stephanie
Bought by
Philbrick William S
Home Financials for this Owner
Home Financials are based on the most recent Mortgage that was taken out on this home.
Original Mortgage
$240,635
Interest Rate
3.87%
Mortgage Type
FHA
Purchase Details
Closed on
Nov 19, 2004
Sold by
Gonzalez 2Nd Luis A
Bought by
Caruso Stephanie
Purchase Details
Closed on
Mar 21, 2000
Sold by
Est Rataich Anne D and Flay Anita
Bought by
Gonzalez Ii Luis A
Create a Home Valuation Report for This Property
The Home Valuation Report is an in-depth analysis detailing your home's value as well as a comparison with similar homes in the area
Home Values in the Area
Average Home Value in this Area
Purchase History
| Date | Buyer | Sale Price | Title Company |
|---|---|---|---|
| Phillbrick Krystina M | -- | None Available | |
| Philbrick William S | $247,000 | -- | |
| Caruso Stephanie | $237,500 | -- | |
| Gonzalez Ii Luis A | $134,500 | -- |
Source: Public Records
Mortgage History
| Date | Status | Borrower | Loan Amount |
|---|---|---|---|
| Open | Phillbrick Krystina M | $198,335 | |
| Previous Owner | Gonzalez Ii Luis A | $240,635 | |
| Previous Owner | Gonzalez Ii Luis A | $208,000 | |
| Previous Owner | Gonzalez Ii Luis A | $25,000 |
Source: Public Records
Tax History
| Year | Tax Paid | Tax Assessment Tax Assessment Total Assessment is a certain percentage of the fair market value that is determined by local assessors to be the total taxable value of land and additions on the property. | Land | Improvement |
|---|---|---|---|---|
| 2025 | $10,194 | $247,310 | $94,370 | $152,940 |
| 2024 | $7,001 | $161,980 | $68,550 | $93,430 |
| 2023 | $6,768 | $161,980 | $68,550 | $93,430 |
| 2022 | $6,654 | $161,980 | $68,550 | $93,430 |
| 2021 | $6,588 | $161,980 | $68,550 | $93,430 |
| 2020 | $6,591 | $161,980 | $68,550 | $93,430 |
| 2019 | $6,599 | $161,980 | $68,550 | $93,430 |
| 2018 | $6,606 | $162,000 | $66,200 | $95,800 |
| 2017 | $6,081 | $152,900 | $66,200 | $86,700 |
| 2016 | $5,893 | $152,900 | $66,200 | $86,700 |
| 2015 | $5,839 | $152,900 | $66,200 | $86,700 |
| 2014 | $5,618 | $152,900 | $66,200 | $86,700 |
Source: Public Records
Map
Nearby Homes
- 72 Concord Dr
- 50 Concord Dr Unit 50
- 25 Sutton Rd
- 22 Winesap Cir Unit 22
- 268 Fox Hill Rd
- 89 Merriman Rd
- 38 Wheeler Rd
- 13 Robbins Ln Unit B
- 1610 Silas Deane Hwy
- 3 Colonial Dr Unit C
- 195 Middletown Ave
- 455 Brimfield Rd
- 137 Dale Rd
- 0 Collier Rd
- 59 Chapin Ave
- 101 Collier Rd
- 155 Old Common Rd
- 508 Highland St
- 119 Coleman Rd
- 5 Robeth Ln
Your Personal Tour Guide
Ask me questions while you tour the home.