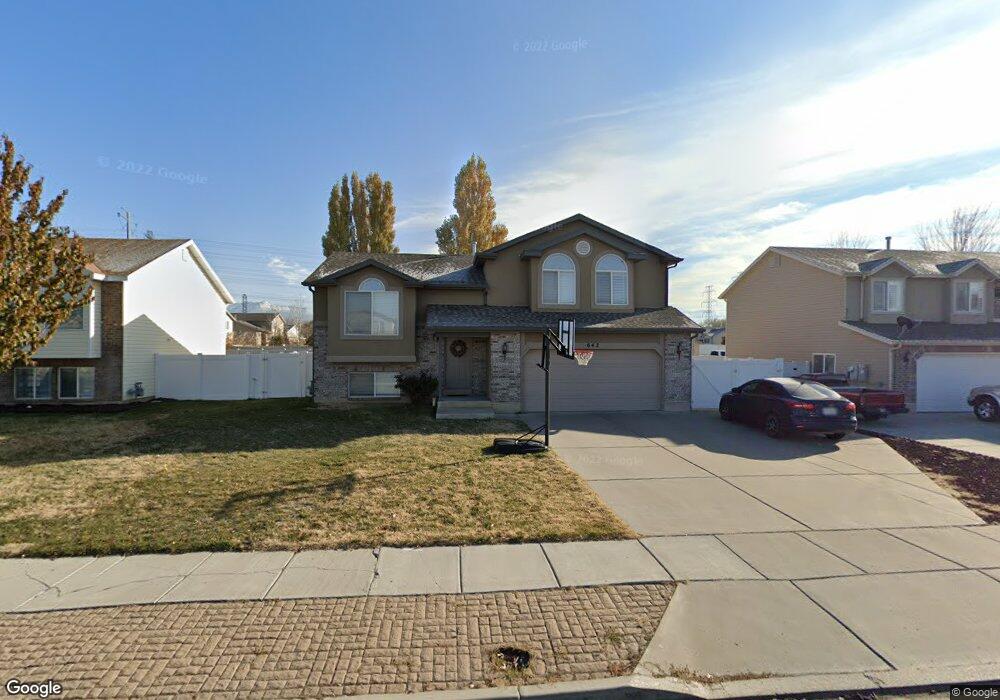
642 N 1725 W Clearfield, UT 84015
Estimated Value: $417,000 - $483,000
4
Beds
3
Baths
1,710
Sq Ft
$261/Sq Ft
Est. Value
About This Home
This home is located at 642 N 1725 W, Clearfield, UT 84015 and is currently estimated at $446,739, approximately $261 per square foot. 642 N 1725 W is a home located in Davis County with nearby schools including Lakeside School, West Point Junior High School, and Syracuse High School.
Ownership History
Date
Name
Owned For
Owner Type
Purchase Details
Closed on
Aug 11, 2017
Sold by
Hammons Troy and Hammons Janet
Bought by
Holley Chace
Current Estimated Value
Home Financials for this Owner
Home Financials are based on the most recent Mortgage that was taken out on this home.
Original Mortgage
$231,800
Outstanding Balance
$193,323
Interest Rate
4.03%
Mortgage Type
New Conventional
Estimated Equity
$253,416
Purchase Details
Closed on
Nov 29, 2006
Sold by
Mike Schultz Construction Inc
Bought by
Hammons Troy and Hammons Janet
Purchase Details
Closed on
May 19, 2005
Sold by
M & D Developers Llc
Bought by
Mike Schultz Construction Inc
Create a Home Valuation Report for This Property
The Home Valuation Report is an in-depth analysis detailing your home's value as well as a comparison with similar homes in the area
Home Values in the Area
Average Home Value in this Area
Purchase History
| Date | Buyer | Sale Price | Title Company |
|---|---|---|---|
| Holley Chace | -- | Metro National Title | |
| Hammons Troy | -- | Heritage West Title Ins Agen | |
| Mike Schultz Construction Inc | -- | Heritage West Title Ins Agen |
Source: Public Records
Mortgage History
| Date | Status | Borrower | Loan Amount |
|---|---|---|---|
| Open | Holley Chace | $231,800 |
Source: Public Records
Tax History Compared to Growth
Tax History
| Year | Tax Paid | Tax Assessment Tax Assessment Total Assessment is a certain percentage of the fair market value that is determined by local assessors to be the total taxable value of land and additions on the property. | Land | Improvement |
|---|---|---|---|---|
| 2025 | $2,414 | $232,101 | $83,254 | $148,847 |
| 2024 | $2,186 | $224,400 | $92,218 | $132,182 |
| 2023 | $2,186 | $391,000 | $103,688 | $287,312 |
| 2022 | $2,302 | $227,700 | $64,945 | $162,755 |
| 2021 | $1,797 | $305,000 | $78,745 | $226,255 |
| 2020 | $1,797 | $261,000 | $65,591 | $195,409 |
| 2019 | $1,720 | $244,000 | $79,110 | $164,890 |
| 2018 | $1,607 | $224,000 | $67,146 | $156,854 |
| 2016 | $1,510 | $108,680 | $25,103 | $83,577 |
| 2015 | $1,594 | $109,120 | $25,103 | $84,017 |
| 2014 | $1,446 | $100,527 | $25,103 | $75,424 |
| 2013 | -- | $93,773 | $22,908 | $70,865 |
Source: Public Records
Map
Nearby Homes
- 1805 W 675 N
- 1652 W 560 N
- 1832 W 725 N
- 1827 W 775 N
- 1774 W 400 N
- 607 N 2000 W
- 575 N 1350 W Unit 137
- 1350 W 300 N Unit 49
- 1350 W 300 N Unit 38
- 1350 W 300 N Unit 29
- 563 N 1350 W Unit 139
- 1337 W 550 N Unit 195
- 2132 W 800 N
- 1122 N 1500 W
- 423 N 1250 W Unit 118
- 2283 W 470 N
- 417 N 1200 W Unit 84
- 47 N 1750 W
- 620 N 1100 W
- 1242 W 1075 N