Estimated Value: $421,000 - $480,000
3
Beds
1
Bath
1,050
Sq Ft
$423/Sq Ft
Est. Value
About This Home
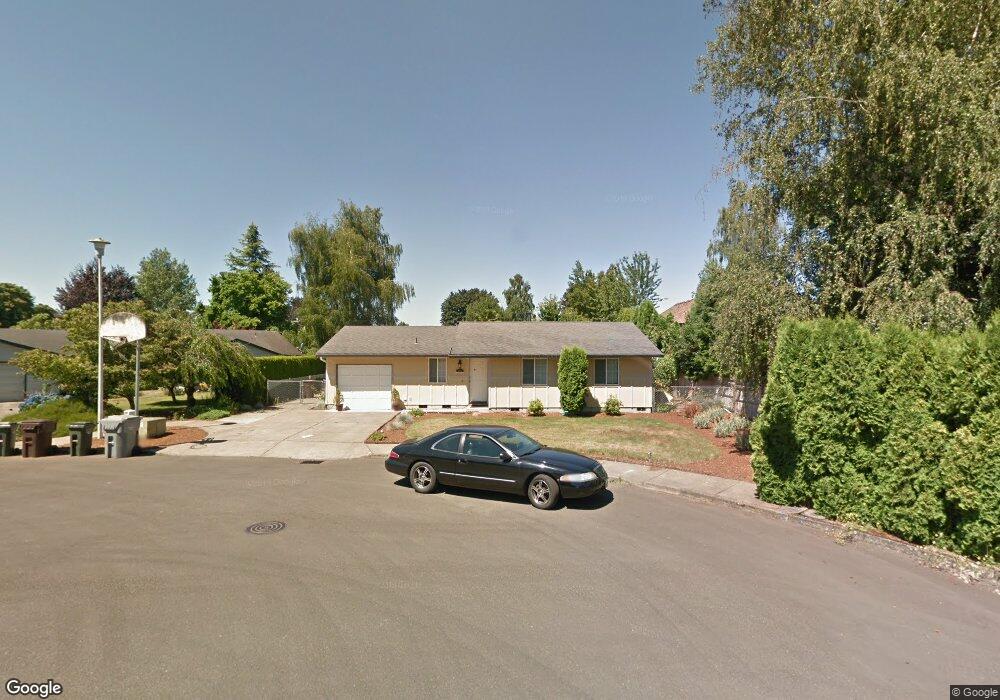
This home is located at 642 NE 21st Place, Canby, OR 97013 and is currently estimated at $444,403, approximately $423 per square foot. 642 NE 21st Place is a home located in Clackamas County with nearby schools including Josefa L. Sambrano Elementary School, Baker Prairie Middle School, and Canby High School.
Ownership History
Date
Name
Owned For
Owner Type
Purchase Details
Closed on
Jun 10, 2020
Sold by
Anderson Margaret E and Froeber Margaret E
Bought by
Froeber Margaret E
Current Estimated Value
Home Financials for this Owner
Home Financials are based on the most recent Mortgage that was taken out on this home.
Original Mortgage
$87,500
Outstanding Balance
$77,390
Interest Rate
3.2%
Mortgage Type
New Conventional
Estimated Equity
$367,013
Purchase Details
Closed on
Sep 25, 1996
Sold by
Hove Randall R
Bought by
Anderson Margaret E
Home Financials for this Owner
Home Financials are based on the most recent Mortgage that was taken out on this home.
Original Mortgage
$104,000
Interest Rate
7.25%
Purchase Details
Closed on
Jun 20, 1995
Sold by
Vannguyen Duc Van and Nguyen Gon Thi
Bought by
Hove Randall R
Home Financials for this Owner
Home Financials are based on the most recent Mortgage that was taken out on this home.
Original Mortgage
$84,000
Interest Rate
7.92%
Create a Home Valuation Report for This Property
The Home Valuation Report is an in-depth analysis detailing your home's value as well as a comparison with similar homes in the area
Home Values in the Area
Average Home Value in this Area
Purchase History
| Date | Buyer | Sale Price | Title Company |
|---|---|---|---|
| Froeber Margaret E | -- | Mortgage Connect Lp | |
| Anderson Margaret E | $118,000 | Chicago Title Insurance Co | |
| Hove Randall R | -- | Fidelity National Title |
Source: Public Records
Mortgage History
| Date | Status | Borrower | Loan Amount |
|---|---|---|---|
| Open | Froeber Margaret E | $87,500 | |
| Closed | Anderson Margaret E | $104,000 | |
| Previous Owner | Hove Randall R | $84,000 |
Source: Public Records
Tax History Compared to Growth
Tax History
| Year | Tax Paid | Tax Assessment Tax Assessment Total Assessment is a certain percentage of the fair market value that is determined by local assessors to be the total taxable value of land and additions on the property. | Land | Improvement |
|---|---|---|---|---|
| 2025 | $3,788 | $213,823 | -- | -- |
| 2024 | $3,682 | $207,596 | -- | -- |
| 2023 | $3,682 | $201,550 | $0 | $0 |
| 2022 | $3,387 | $195,680 | $0 | $0 |
| 2021 | $3,261 | $189,981 | $0 | $0 |
| 2020 | $3,203 | $184,448 | $0 | $0 |
| 2019 | $3,050 | $179,076 | $0 | $0 |
| 2018 | $2,982 | $173,860 | $0 | $0 |
| 2017 | $2,906 | $168,796 | $0 | $0 |
| 2016 | $2,809 | $163,880 | $0 | $0 |
| 2015 | $2,713 | $159,107 | $0 | $0 |
| 2014 | $2,635 | $154,473 | $0 | $0 |
Source: Public Records
Map
Nearby Homes
- 660 NE 20th Ave
- 2152 N Laurelwood St
- 1751 N Laurelwood Loop
- 832 NE 17th Ave
- 838 NE 17th Ave
- 844 NE 17th Ave
- 1200 NE Territorial Rd Unit 93
- 1750 N Oak St
- 853 NE 17th Ave
- 878 NE 17th Ave
- 952 NE 17th Ave
- 947 NE 17th Ave
- 1009 NE 17th Ave
- 312 NE 14th Ave
- 1721 N Hyssop St
- 860 NE 14th Ave
- 1422 NE 18th Place
- 1614 NW 16th Ave
- 187 NE 14th Ave
- 1552 NE 19th Loop
- 645 NE 22nd Ave
- 633 NE 21st Place
- 637 NE 22nd Ave
- 675 NE 22nd Ave
- 641 NE 22nd Ave
- 647 NE 21st Place
- 631 NE 22nd Ave
- 676 NE 21st Place
- 599 NE 22nd Ave
- 615 NE 22nd Ave
- 695 NE 22nd Ave
- 2121 N Maple St
- 673 NE 21st Place
- 597 NE 22nd Ave
- 627 NE 22nd Ave
- 2137 NE 21st (2540-47) Place
- 2137 NE 21st (2811-47) Place
- 690 NE 22nd Ave
- 552 NE 21st Place
- 548 NE 21st Place