Estimated Value: $165,000 - $251,000
3
Beds
2
Baths
1,813
Sq Ft
$120/Sq Ft
Est. Value
About This Home
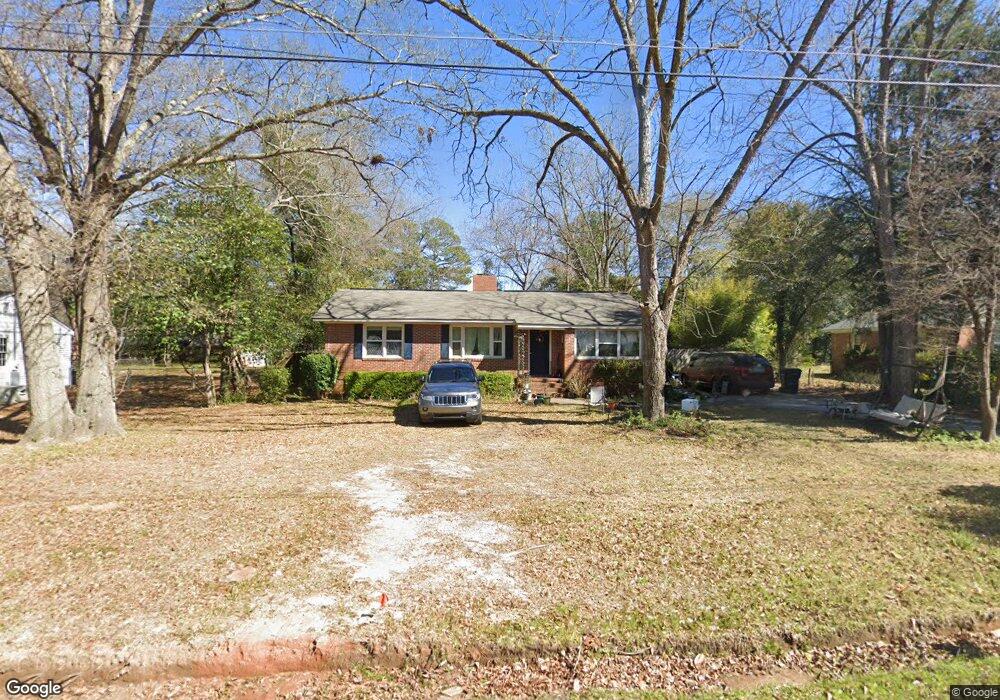
This home is located at 642 Pine Ridge St, Perry, GA 31069 and is currently estimated at $218,198, approximately $120 per square foot. 642 Pine Ridge St is a home located in Houston County with nearby schools including Tucker Elementary School, Perry Middle School, and Perry High School.
Ownership History
Date
Name
Owned For
Owner Type
Purchase Details
Closed on
Apr 28, 2017
Sold by
Carnley Scot B
Bought by
Carlton Belvin
Current Estimated Value
Home Financials for this Owner
Home Financials are based on the most recent Mortgage that was taken out on this home.
Original Mortgage
$112,493
Outstanding Balance
$93,654
Interest Rate
4.14%
Mortgage Type
VA
Estimated Equity
$124,544
Purchase Details
Closed on
Oct 19, 2015
Sold by
Carnley Holly D
Bought by
Carnley Scot B
Purchase Details
Closed on
May 13, 2004
Sold by
Carnley Scot B
Bought by
Carnley Scot B and Carnley Holly D
Purchase Details
Closed on
Aug 16, 1999
Sold by
Warner Mary B
Bought by
Carnley Scot B
Purchase Details
Closed on
Dec 8, 1994
Sold by
Warner Paul Cunningham
Bought by
Warner Paul Cunningham and Mary B*
Purchase Details
Closed on
Sep 9, 1972
Sold by
Burton Woodrow E
Bought by
Warner Paul Cunningham
Purchase Details
Closed on
Jul 3, 1970
Sold by
Community Realty Inc
Bought by
Burton Woodrow E
Purchase Details
Closed on
Jun 16, 1970
Sold by
Davis Elbert R
Bought by
Community Realty Inc
Purchase Details
Closed on
Jul 29, 1966
Sold by
Allmond George
Bought by
Davis Elbert R
Purchase Details
Closed on
Mar 23, 1956
Bought by
Allmond George
Create a Home Valuation Report for This Property
The Home Valuation Report is an in-depth analysis detailing your home's value as well as a comparison with similar homes in the area
Home Values in the Area
Average Home Value in this Area
Purchase History
| Date | Buyer | Sale Price | Title Company |
|---|---|---|---|
| Carlton Belvin | $108,900 | -- | |
| Carnley Scot B | -- | -- | |
| Carnley Scot B | -- | -- | |
| Carnley Scot B | $77,000 | -- | |
| Warner Paul Cunningham | -- | -- | |
| Warner Paul Cunningham | -- | -- | |
| Burton Woodrow E | -- | -- | |
| Community Realty Inc | -- | -- | |
| Davis Elbert R | -- | -- | |
| Allmond George | -- | -- |
Source: Public Records
Mortgage History
| Date | Status | Borrower | Loan Amount |
|---|---|---|---|
| Open | Carlton Belvin | $112,493 |
Source: Public Records
Tax History Compared to Growth
Tax History
| Year | Tax Paid | Tax Assessment Tax Assessment Total Assessment is a certain percentage of the fair market value that is determined by local assessors to be the total taxable value of land and additions on the property. | Land | Improvement |
|---|---|---|---|---|
| 2024 | $2,153 | $58,600 | $6,160 | $52,440 |
| 2023 | $1,833 | $49,560 | $6,160 | $43,400 |
| 2022 | $1,062 | $46,200 | $6,160 | $40,040 |
| 2021 | $941 | $40,720 | $6,160 | $34,560 |
| 2020 | $928 | $39,960 | $6,160 | $33,800 |
| 2019 | $928 | $39,960 | $6,160 | $33,800 |
| 2018 | $928 | $39,960 | $6,160 | $33,800 |
| 2017 | $845 | $36,320 | $6,160 | $30,160 |
| 2016 | $805 | $34,560 | $6,160 | $28,400 |
| 2015 | $807 | $34,560 | $6,160 | $28,400 |
| 2014 | -- | $34,560 | $6,160 | $28,400 |
| 2013 | -- | $34,560 | $6,160 | $28,400 |
Source: Public Records
Map
Nearby Homes
- 625 Cooper St
- 630 Pine Ridge St
- 624 Pine Ridge St
- 706 Hillcrest Ave
- 1207 Tucker Rd
- 903 Massee Ln
- 905 Massee Ln
- 1406 Main St
- 1432 Duncan Ave
- 1438 Elizabeth Ave
- 0 Carroll Aly
- 606 Frank Satterfield Rd
- 1212 Swift St
- 1405 Cambridge Rd
- 1207 Swift St
- 1152 Lovely Ln
- 117 Constance Ct
- 1808 Ross St
- 113 Pridgen Pass
- 118 Constance Ct
- 644 Pine Ridge St
- 640 Pine Ridge St
- 629 Hillcrest Ave
- 631 Hillcrest Ave
- 627 Hillcrest Ave
- 646 Pine Ridge St
- 638 Pine Ridge St
- 629 Pine Ridge St
- 631 Pine Ridge St
- 633 Hillcrest Ave
- 625 Hillcrest Ave
- 627 Pine Ridge St
- 648 Pine Ridge St
- 636 Pine Ridge St
- 633 Pine Ridge St
- 635 Hillcrest Ave
- 623 Hillcrest Ave
- 633 Pineridge Dr #3`
- 633 Pineridge Drive #3
- 633 Pine Ridge Dr #1