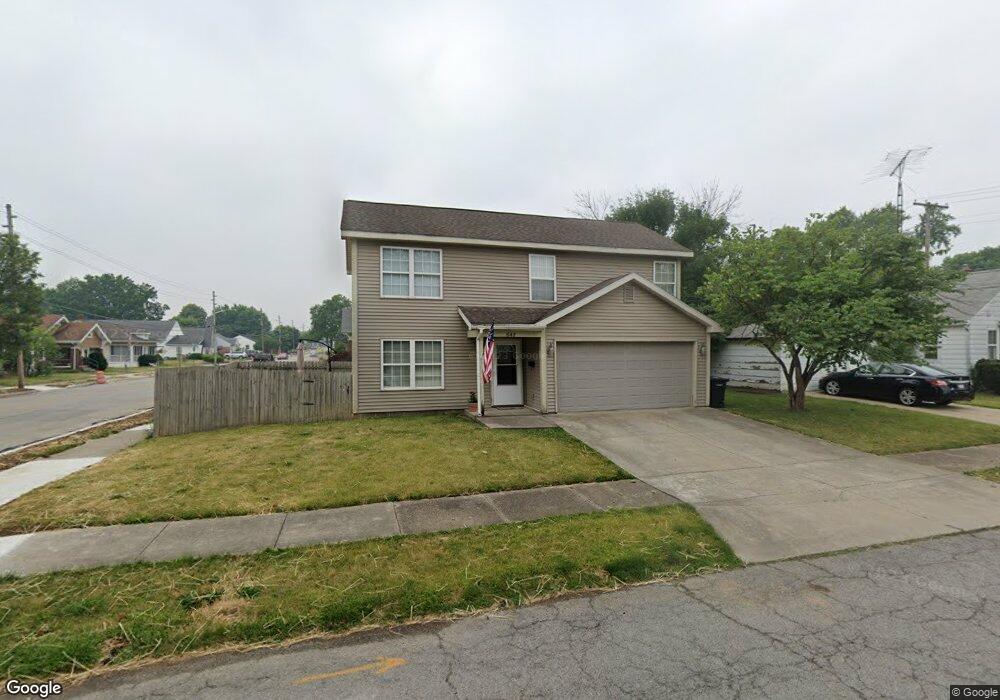
642 S 27th St Lafayette, IN 47904
Columbian Park NeighborhoodEstimated Value: $214,000 - $219,912
3
Beds
1
Bath
1,323
Sq Ft
$164/Sq Ft
Est. Value
About This Home
This home is located at 642 S 27th St, Lafayette, IN 47904 and is currently estimated at $216,478, approximately $163 per square foot. 642 S 27th St is a home located in Tippecanoe County with nearby schools including Murdock Elementary School, Sunnyside Intermediate School, and Lafayette Tecumseh Junior High School.
Ownership History
Date
Name
Owned For
Owner Type
Purchase Details
Closed on
Oct 10, 2016
Sold by
Burns Steve O
Bought by
Miteff Margaret E
Current Estimated Value
Home Financials for this Owner
Home Financials are based on the most recent Mortgage that was taken out on this home.
Original Mortgage
$71,403
Outstanding Balance
$57,243
Interest Rate
3.46%
Mortgage Type
FHA
Estimated Equity
$159,235
Purchase Details
Closed on
Oct 16, 2007
Sold by
Fannie Mae
Bought by
Burns Steve O
Home Financials for this Owner
Home Financials are based on the most recent Mortgage that was taken out on this home.
Original Mortgage
$74,000
Interest Rate
6.38%
Mortgage Type
New Conventional
Purchase Details
Closed on
Jul 20, 2007
Sold by
Phh Mortgage Corp
Bought by
Federal National Mortgage Association
Purchase Details
Closed on
Jun 6, 2007
Sold by
Dilley Dawn
Bought by
Phh Mortgage Corp and Cendant Mortgage Corp
Create a Home Valuation Report for This Property
The Home Valuation Report is an in-depth analysis detailing your home's value as well as a comparison with similar homes in the area
Home Values in the Area
Average Home Value in this Area
Purchase History
| Date | Buyer | Sale Price | Title Company |
|---|---|---|---|
| Miteff Margaret E | -- | -- | |
| Burns Steve O | -- | None Available | |
| Federal National Mortgage Association | -- | None Available | |
| Phh Mortgage Corp | $108,601 | None Available |
Source: Public Records
Mortgage History
| Date | Status | Borrower | Loan Amount |
|---|---|---|---|
| Open | Miteff Margaret E | $71,403 | |
| Previous Owner | Burns Steve O | $74,000 |
Source: Public Records
Tax History Compared to Growth
Tax History
| Year | Tax Paid | Tax Assessment Tax Assessment Total Assessment is a certain percentage of the fair market value that is determined by local assessors to be the total taxable value of land and additions on the property. | Land | Improvement |
|---|---|---|---|---|
| 2024 | $367 | $155,800 | $9,000 | $146,800 |
| 2023 | $360 | $144,700 | $9,000 | $135,700 |
| 2022 | $353 | $130,700 | $9,000 | $121,700 |
| 2021 | $346 | $110,600 | $9,000 | $101,600 |
| 2020 | $339 | $93,500 | $9,000 | $84,500 |
| 2019 | $341 | $91,500 | $9,900 | $81,600 |
| 2018 | $586 | $88,500 | $9,900 | $78,600 |
| 2017 | $589 | $89,200 | $9,900 | $79,300 |
| 2016 | $631 | $88,500 | $9,900 | $78,600 |
| 2014 | $1,736 | $86,800 | $9,900 | $76,900 |
| 2013 | $1,672 | $83,600 | $9,900 | $73,700 |
Source: Public Records
Map
Nearby Homes