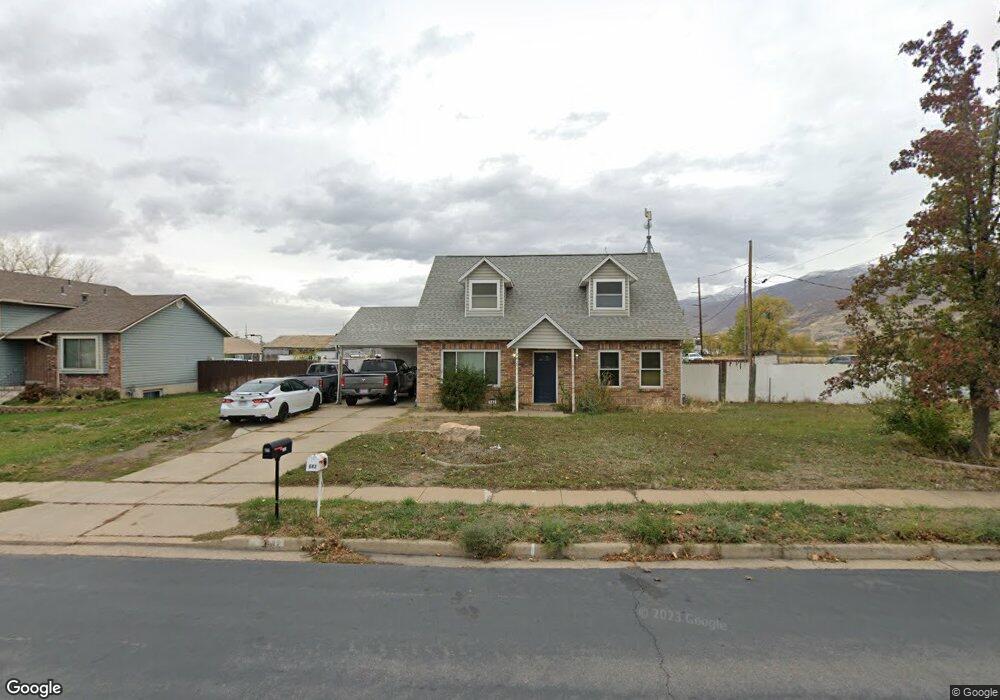
642 W 2300 N West Bountiful, UT 84087
Estimated Value: $496,839 - $557,000
5
Beds
2
Baths
1,737
Sq Ft
$309/Sq Ft
Est. Value
About This Home
This home is located at 642 W 2300 N, West Bountiful, UT 84087 and is currently estimated at $535,960, approximately $308 per square foot. 642 W 2300 N is a home located in Davis County with nearby schools including West Bountiful Elementary School, Bountiful Junior High School, and Viewmont High School.
Ownership History
Date
Name
Owned For
Owner Type
Purchase Details
Closed on
Sep 8, 2023
Sold by
Harding Randy
Bought by
Vanos Matthew
Current Estimated Value
Home Financials for this Owner
Home Financials are based on the most recent Mortgage that was taken out on this home.
Original Mortgage
$109,364
Outstanding Balance
$106,872
Interest Rate
6.81%
Mortgage Type
FHA
Estimated Equity
$429,088
Purchase Details
Closed on
Jul 21, 2004
Sold by
Best Stefani
Bought by
Harding Randy
Home Financials for this Owner
Home Financials are based on the most recent Mortgage that was taken out on this home.
Original Mortgage
$82,500
Interest Rate
8%
Mortgage Type
Purchase Money Mortgage
Purchase Details
Closed on
Jul 20, 2001
Sold by
Hales Christopher N
Bought by
Best Stefani
Purchase Details
Closed on
Nov 21, 1997
Sold by
Hales Chris
Bought by
Hales Boyd N and Hales Mavis S
Home Financials for this Owner
Home Financials are based on the most recent Mortgage that was taken out on this home.
Original Mortgage
$107,800
Interest Rate
7.23%
Create a Home Valuation Report for This Property
The Home Valuation Report is an in-depth analysis detailing your home's value as well as a comparison with similar homes in the area
Home Values in the Area
Average Home Value in this Area
Purchase History
| Date | Buyer | Sale Price | Title Company |
|---|---|---|---|
| Vanos Matthew | -- | First American Title Insurance | |
| Harding Randy | -- | Bonneville Title Company Inc | |
| Best Stefani | -- | Bonneville Title Company Inc | |
| Hales Christopher N | -- | Bonneville Title Company Inc | |
| Hales Boyd N | -- | Associated Title Company |
Source: Public Records
Mortgage History
| Date | Status | Borrower | Loan Amount |
|---|---|---|---|
| Open | Vanos Matthew | $109,364 | |
| Previous Owner | Harding Randy | $82,500 | |
| Previous Owner | Hales Boyd N | $107,800 |
Source: Public Records
Tax History Compared to Growth
Tax History
| Year | Tax Paid | Tax Assessment Tax Assessment Total Assessment is a certain percentage of the fair market value that is determined by local assessors to be the total taxable value of land and additions on the property. | Land | Improvement |
|---|---|---|---|---|
| 2025 | $2,489 | $234,300 | $103,008 | $131,292 |
| 2024 | $2,340 | $224,400 | $84,437 | $139,963 |
| 2023 | $2,262 | $217,250 | $88,913 | $128,337 |
| 2022 | $2,285 | $404,000 | $138,218 | $265,782 |
| 2021 | $2,000 | $299,000 | $99,805 | $199,195 |
| 2020 | $1,852 | $262,000 | $94,758 | $167,242 |
| 2019 | $1,899 | $252,000 | $97,358 | $154,642 |
| 2018 | $1,853 | $250,000 | $100,260 | $149,740 |
| 2016 | $1,435 | $105,600 | $27,818 | $77,782 |
| 2015 | $1,417 | $96,030 | $27,818 | $68,212 |
| 2014 | $1,497 | $110,647 | $27,818 | $82,829 |
| 2013 | -- | $99,773 | $25,046 | $74,727 |
Source: Public Records
Map
Nearby Homes
- 580 W 2125 N
- 2339 N 800 W
- 2257 N 830 W
- 2035 N 800 W
- 789 W 1950 N
- 420 Rawlins Cir
- 1520 N 550 W
- 988 W 1950 N Unit 134
- 147 N 360 W Unit 21
- 2 S 285 W
- 239 Lyman Ln
- 234 Leah Cir
- 204 Lyman Ln
- 215 Lyman Ln
- 353 Florentine Ln
- 117 Cara Vella Ln
- 493 W 620 N Unit 122
- 1503 N 300 W
- Hampton Traditional Plan at Belmont Farms
- 88 W 50 S Unit F9