Estimated Value: $48,000 - $63,152
1
Bed
1
Bath
514
Sq Ft
$104/Sq Ft
Est. Value
About This Home
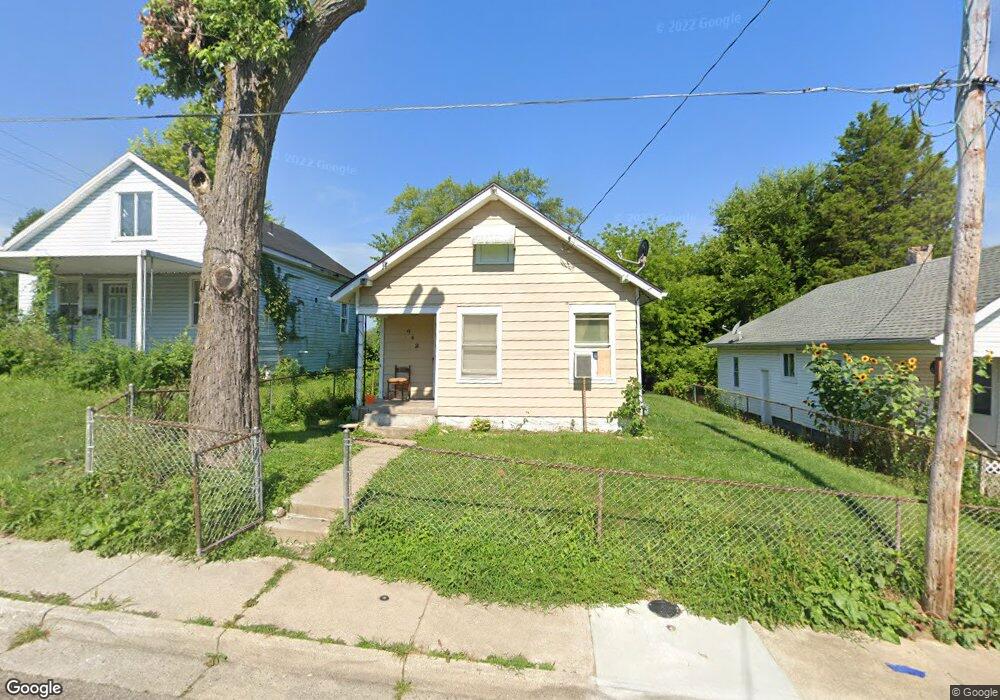
This home is located at 642 Xenia Ave, Xenia, OH 45385 and is currently estimated at $53,384, approximately $103 per square foot. 642 Xenia Ave is a home located in Greene County with nearby schools including Xenia High School, Summit Academy Community School for Alternative Learners - Xenia, and Legacy Christian Academy.
Ownership History
Date
Name
Owned For
Owner Type
Purchase Details
Closed on
Sep 26, 2024
Sold by
Nolen Darby J and Metzler Darby J
Bought by
Crossroads Properties Llc
Current Estimated Value
Purchase Details
Closed on
Oct 28, 2016
Sold by
Combs Lloyd S and Combs Sheri D
Bought by
Combs Lloyd S and Combs Joyce L
Purchase Details
Closed on
Mar 8, 2004
Sold by
Combs and Combs C
Bought by
Combs Lloyd S and Combs Sherie D
Home Financials for this Owner
Home Financials are based on the most recent Mortgage that was taken out on this home.
Original Mortgage
$36,000
Interest Rate
5.77%
Mortgage Type
Unknown
Purchase Details
Closed on
Dec 11, 2003
Sold by
Howson Laura C and Howson Robert C
Bought by
Combs & Combs & Ohio Partnership
Create a Home Valuation Report for This Property
The Home Valuation Report is an in-depth analysis detailing your home's value as well as a comparison with similar homes in the area
Home Values in the Area
Average Home Value in this Area
Purchase History
| Date | Buyer | Sale Price | Title Company |
|---|---|---|---|
| Crossroads Properties Llc | -- | None Listed On Document | |
| Metzler Darby J | $45,000 | None Listed On Document | |
| Combs Lloyd S | -- | Attorney | |
| Combs Lloyd S | -- | -- | |
| Combs & Combs & Ohio Partnership | $290,000 | -- |
Source: Public Records
Mortgage History
| Date | Status | Borrower | Loan Amount |
|---|---|---|---|
| Previous Owner | Combs Lloyd S | $36,000 |
Source: Public Records
Tax History Compared to Growth
Tax History
| Year | Tax Paid | Tax Assessment Tax Assessment Total Assessment is a certain percentage of the fair market value that is determined by local assessors to be the total taxable value of land and additions on the property. | Land | Improvement |
|---|---|---|---|---|
| 2024 | $728 | $17,010 | $4,410 | $12,600 |
| 2023 | $728 | $17,010 | $4,410 | $12,600 |
| 2022 | $658 | $13,110 | $3,530 | $9,580 |
| 2021 | $667 | $13,110 | $3,530 | $9,580 |
| 2020 | $639 | $13,110 | $3,530 | $9,580 |
| 2019 | $644 | $12,440 | $3,280 | $9,160 |
| 2018 | $646 | $12,440 | $3,280 | $9,160 |
| 2017 | $628 | $12,440 | $3,280 | $9,160 |
| 2016 | $628 | $11,870 | $3,280 | $8,590 |
| 2015 | $630 | $11,870 | $3,280 | $8,590 |
| 2014 | $603 | $11,870 | $3,280 | $8,590 |
Source: Public Records
Map
Nearby Homes