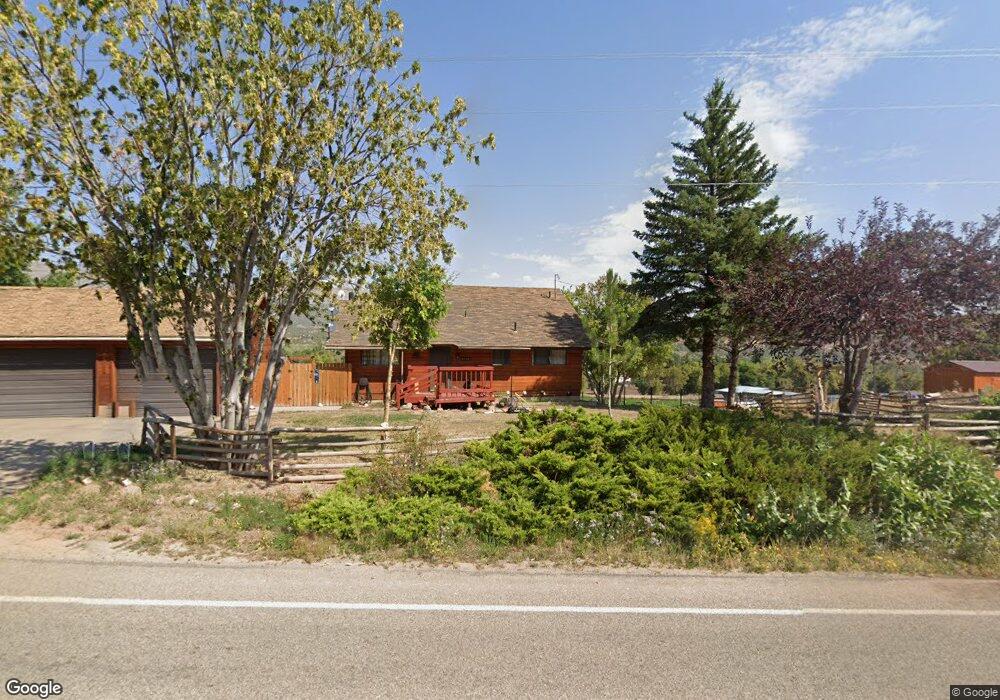
6420 Dry Fork Canyon Rd Vernal, UT 84078
Estimated Value: $367,000 - $561,000
4
Beds
3
Baths
2,468
Sq Ft
$173/Sq Ft
Est. Value
About This Home
This home is located at 6420 Dry Fork Canyon Rd, Vernal, UT 84078 and is currently estimated at $427,057, approximately $173 per square foot. 6420 Dry Fork Canyon Rd is a home located in Uintah County with nearby schools including Maeser School, Uintah Middle School, and Vernal Middle School.
Ownership History
Date
Name
Owned For
Owner Type
Purchase Details
Closed on
Dec 23, 2010
Sold by
Imlay David A and Imlay Lauren D
Bought by
Simonsen Janna M
Current Estimated Value
Home Financials for this Owner
Home Financials are based on the most recent Mortgage that was taken out on this home.
Original Mortgage
$151,500
Interest Rate
4.77%
Mortgage Type
New Conventional
Purchase Details
Closed on
Jun 5, 2008
Sold by
Vencill Steven J
Bought by
Imlay David A and Imlay Lauren D
Home Financials for this Owner
Home Financials are based on the most recent Mortgage that was taken out on this home.
Original Mortgage
$238,500
Interest Rate
6%
Mortgage Type
New Conventional
Purchase Details
Closed on
Feb 21, 2006
Sold by
Greenwood Charles and Greenwood Fonda
Bought by
Vencill Steven J
Home Financials for this Owner
Home Financials are based on the most recent Mortgage that was taken out on this home.
Original Mortgage
$50,000
Interest Rate
6.15%
Mortgage Type
New Conventional
Create a Home Valuation Report for This Property
The Home Valuation Report is an in-depth analysis detailing your home's value as well as a comparison with similar homes in the area
Home Values in the Area
Average Home Value in this Area
Purchase History
| Date | Buyer | Sale Price | Title Company |
|---|---|---|---|
| Simonsen Janna M | -- | -- | |
| Imlay David A | -- | -- | |
| Vencill Steven J | -- | -- |
Source: Public Records
Mortgage History
| Date | Status | Borrower | Loan Amount |
|---|---|---|---|
| Previous Owner | Simonsen Janna M | $151,500 | |
| Previous Owner | Imlay David A | $238,500 | |
| Previous Owner | Vencill Steven J | $50,000 |
Source: Public Records
Tax History Compared to Growth
Tax History
| Year | Tax Paid | Tax Assessment Tax Assessment Total Assessment is a certain percentage of the fair market value that is determined by local assessors to be the total taxable value of land and additions on the property. | Land | Improvement |
|---|---|---|---|---|
| 2024 | $1,560 | $188,322 | $30,579 | $157,743 |
| 2023 | $1,560 | $154,591 | $30,579 | $124,012 |
| 2022 | $1,426 | $140,324 | $30,579 | $109,745 |
| 2021 | $1,302 | $105,058 | $22,294 | $82,764 |
| 2020 | $1,245 | $103,176 | $22,000 | $81,176 |
| 2019 | $1,195 | $97,865 | $22,000 | $75,865 |
| 2018 | $1,149 | $94,253 | $22,000 | $72,253 |
| 2017 | $11 | $94,253 | $22,000 | $72,253 |
| 2016 | $1,164 | $104,764 | $22,000 | $82,764 |
| 2015 | $1,155 | $113,040 | $22,000 | $91,040 |
| 2014 | $1,137 | $113,040 | $22,000 | $91,040 |
| 2013 | $1,162 | $113,040 | $22,000 | $91,040 |
Source: Public Records
Map
Nearby Homes
- 6407 N Dry Fork Canyon Rd
- 7461 Deep Creek Rd
- 7748 Mountain Dell Dr
- 6569 Dry Fork Settlement Rd
- 8552 W Sawtooth Park Dr
- 7737 Sawtooth Cove Dr
- 7424 Old Power Plant Rd
- 3443 N 3500 W
- 4835 W Hillside Dr
- 4845 W Hillside Dr
- 4571 W Hillside Dr
- 2745 N 2500 W
- 2741 N 2500 W
- 1482 N 4075 W
- 1388 N 4075 W
- 1298 N 4075 W
- 1320 N 4075 W
- 1428 N 4075 W
- 1198 N 4090 W
- 1165 N 4090 W Unit 11
- 6420 Dry Fork Canyon Rd
- 6400 Dry Fork Canyon Rd
- 6407 Dry Fork Canyon Rd
- 6407 Dry Fork Canyon Rd
- 6462 Dry Fork Canyon Rd
- 6519 N 6500 W
- 6369 Dry Fork Canyon Rd
- 6603 N 6500 W
- 6434 N Dry Fork Canyon Rd
- 6434 Dry Fork Canyon
- 6434 Dry Fork Canyon Rd
- 6434 Dry Fork Settlement Rd
- 6440 Dry Fork Canyon Rd
- 6536 Dry Fork Settlement Rd
- 6536 Dry Fork Canyon Rd
- 6522 Dry Fork Canyon Rd
- 6933 Dry Fork Settlement Rd
- 6334 Dry Fork Canyon Rd
- 6646 Dry Fork Canyon Rd
- 6190 Dry Fork Canyon Rd