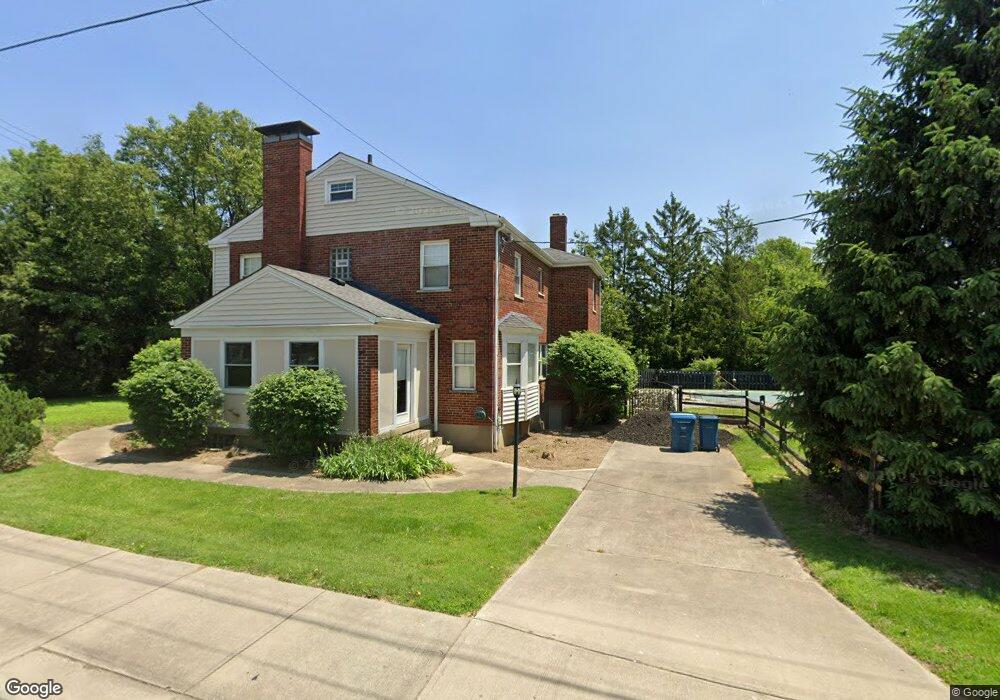
6421 Euclid Ave Cincinnati, OH 45243
Estimated Value: $758,000 - $823,000
4
Beds
3
Baths
3,502
Sq Ft
$224/Sq Ft
Est. Value
About This Home
This home is located at 6421 Euclid Ave, Cincinnati, OH 45243 and is currently estimated at $782,884, approximately $223 per square foot. 6421 Euclid Ave is a home located in Hamilton County with nearby schools including Madeira Elementary School, Madeira Middle School, and Madeira High School.
Ownership History
Date
Name
Owned For
Owner Type
Purchase Details
Closed on
Jan 29, 2015
Sold by
Gilligan Jill M and Smith Jill M
Bought by
Smith Edmund C
Current Estimated Value
Purchase Details
Closed on
Mar 2, 2001
Sold by
Smith Edmund C
Bought by
Smith Edmund C and Gilligan Jill M
Home Financials for this Owner
Home Financials are based on the most recent Mortgage that was taken out on this home.
Original Mortgage
$203,400
Outstanding Balance
$72,813
Interest Rate
7.13%
Mortgage Type
Unknown
Estimated Equity
$710,071
Purchase Details
Closed on
Feb 8, 2001
Sold by
Andrews Nicholas W
Bought by
Andrews Elizabeth A
Home Financials for this Owner
Home Financials are based on the most recent Mortgage that was taken out on this home.
Original Mortgage
$203,400
Outstanding Balance
$72,813
Interest Rate
7.13%
Mortgage Type
Unknown
Estimated Equity
$710,071
Create a Home Valuation Report for This Property
The Home Valuation Report is an in-depth analysis detailing your home's value as well as a comparison with similar homes in the area
Home Values in the Area
Average Home Value in this Area
Purchase History
| Date | Buyer | Sale Price | Title Company |
|---|---|---|---|
| Smith Edmund C | -- | Attorney | |
| Smith Edmund C | -- | Prodigy Title Agency Inc | |
| Smith Edmund C | $226,000 | Prodigy Title Agency Inc | |
| Andrews Elizabeth A | -- | Prodigy Title Agency Inc |
Source: Public Records
Mortgage History
| Date | Status | Borrower | Loan Amount |
|---|---|---|---|
| Open | Smith Edmund C | $203,400 |
Source: Public Records
Tax History Compared to Growth
Tax History
| Year | Tax Paid | Tax Assessment Tax Assessment Total Assessment is a certain percentage of the fair market value that is determined by local assessors to be the total taxable value of land and additions on the property. | Land | Improvement |
|---|---|---|---|---|
| 2024 | $10,821 | $188,570 | $45,080 | $143,490 |
| 2023 | $10,958 | $188,570 | $45,080 | $143,490 |
| 2022 | $10,788 | $151,795 | $36,064 | $115,731 |
| 2021 | $10,565 | $151,795 | $36,064 | $115,731 |
| 2020 | $9,767 | $151,795 | $36,064 | $115,731 |
| 2019 | $9,455 | $135,531 | $32,200 | $103,331 |
| 2018 | $9,530 | $135,531 | $32,200 | $103,331 |
| 2017 | $9,042 | $135,531 | $32,200 | $103,331 |
| 2016 | $8,690 | $122,728 | $19,110 | $103,618 |
| 2015 | $8,035 | $122,728 | $19,110 | $103,618 |
| 2014 | $8,081 | $122,728 | $19,110 | $103,618 |
| 2013 | $7,986 | $116,883 | $18,200 | $98,683 |
Source: Public Records
Map
Nearby Homes
- 6866 Kenwood Rd
- 6887 Kenwood Rd
- 6849 Springcrest Cir
- 6638 Dawson Rd
- 6947 Euclid Ave
- 6752 Rose Crest Ave
- 7620 Montgomery Rd
- 6860 Dawson Rd
- 6951 Miami Hills Dr
- 7123 Silver Crest Dr
- 7002 Dawson Rd
- 4576 Orchard Ln
- 4385 Grinnell Dr
- 7406 Dawson Rd
- 7112 Summit Ave
- 4425 Clifford Rd
- 7317 Euclid Ave
- 7800 Spirea Dr
- 7389 Southside Ave
- 6960 Kenwood Rd
- 6461 Euclid Ave
- 6395 Euclid Rd
- 6475 Euclid Ave
- 6948 Kenwood Rd
- 6381 Euclid Rd
- 6396 Euclid Rd
- 6932 Kenwood Rd
- 6491 Euclid Ave
- 6369 Euclid Rd
- 6929 Kenwood Rd
- 6380 Euclid Rd
- 6505 Euclid Ave
- 6430 Euclid Ave
- 7198 Kenwood Rd
- 6920 Kenwood Rd
- 6355 Euclid Rd
- 6440 Euclid Ave
- 6510 Michael Dr
- 6921 Kenwood Rd