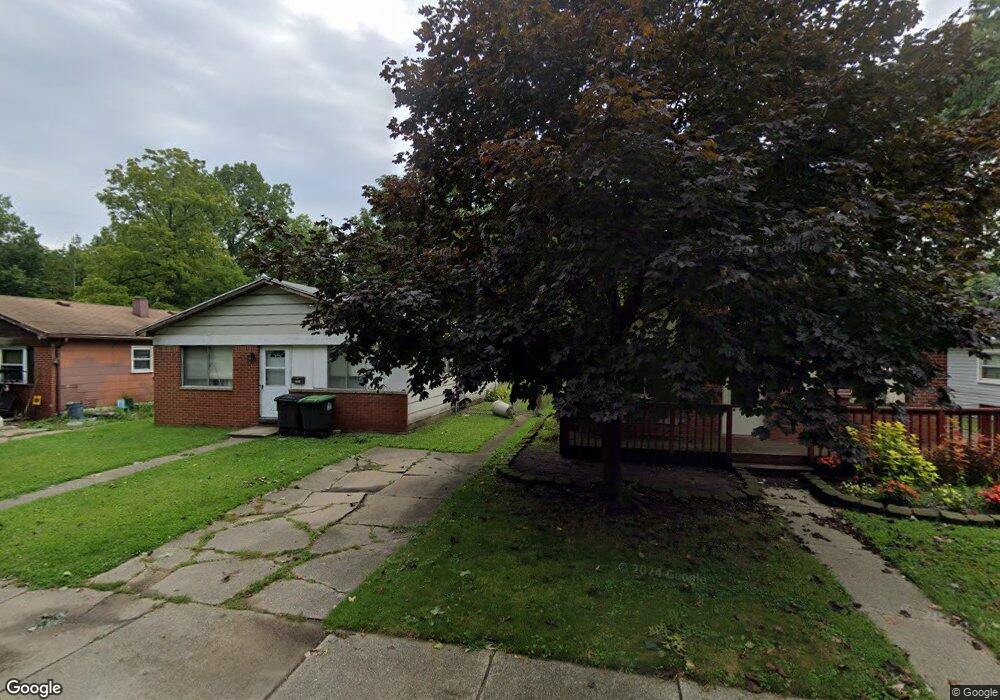
6421 Oak St Taylor, MI 48180
Estimated Value: $126,984 - $145,000
--
Bed
--
Bath
949
Sq Ft
$144/Sq Ft
Est. Value
About This Home
This home is located at 6421 Oak St, Taylor, MI 48180 and is currently estimated at $136,746, approximately $144 per square foot. 6421 Oak St is a home located in Wayne County with nearby schools including Clarence Randall Elementary School, Hoover Middle School, and Quest Charter Academy.
Ownership History
Date
Name
Owned For
Owner Type
Purchase Details
Closed on
Feb 20, 2025
Sold by
Blue Ocean Llc
Bought by
Mm1 Partners Llc
Current Estimated Value
Home Financials for this Owner
Home Financials are based on the most recent Mortgage that was taken out on this home.
Original Mortgage
$120,000
Outstanding Balance
$119,305
Interest Rate
7.04%
Mortgage Type
New Conventional
Estimated Equity
$17,441
Purchase Details
Closed on
Aug 30, 2024
Sold by
Kuitula Douglas Edward and Kuitula Ronald
Bought by
Blue Ocean Llc
Home Financials for this Owner
Home Financials are based on the most recent Mortgage that was taken out on this home.
Original Mortgage
$109,300
Interest Rate
6.78%
Mortgage Type
Construction
Create a Home Valuation Report for This Property
The Home Valuation Report is an in-depth analysis detailing your home's value as well as a comparison with similar homes in the area
Home Values in the Area
Average Home Value in this Area
Purchase History
| Date | Buyer | Sale Price | Title Company |
|---|---|---|---|
| Mm1 Partners Llc | -- | Mason Burgess Title Agency | |
| Mm1 Partners Llc | -- | Mason Burgess Title Agency | |
| Blue Ocean Llc | $48,000 | None Listed On Document |
Source: Public Records
Mortgage History
| Date | Status | Borrower | Loan Amount |
|---|---|---|---|
| Open | Mm1 Partners Llc | $120,000 | |
| Closed | Mm1 Partners Llc | $120,000 | |
| Previous Owner | Blue Ocean Llc | $109,300 |
Source: Public Records
Tax History Compared to Growth
Tax History
| Year | Tax Paid | Tax Assessment Tax Assessment Total Assessment is a certain percentage of the fair market value that is determined by local assessors to be the total taxable value of land and additions on the property. | Land | Improvement |
|---|---|---|---|---|
| 2025 | $1,123 | $59,500 | $0 | $0 |
| 2024 | $1,123 | $52,400 | $0 | $0 |
| 2023 | $1,327 | $46,400 | $0 | $0 |
| 2022 | $1,072 | $41,800 | $0 | $0 |
| 2021 | $1,169 | $38,500 | $0 | $0 |
| 2020 | $1,157 | $34,800 | $0 | $0 |
| 2019 | $115,785 | $28,500 | $0 | $0 |
| 2018 | $921 | $22,000 | $0 | $0 |
| 2017 | $473 | $22,400 | $0 | $0 |
| 2016 | $1,122 | $21,800 | $0 | $0 |
| 2015 | $2,080 | $20,800 | $0 | $0 |
| 2013 | $2,110 | $21,900 | $0 | $0 |
| 2012 | $931 | $21,400 | $7,000 | $14,400 |
Source: Public Records
Map
Nearby Homes